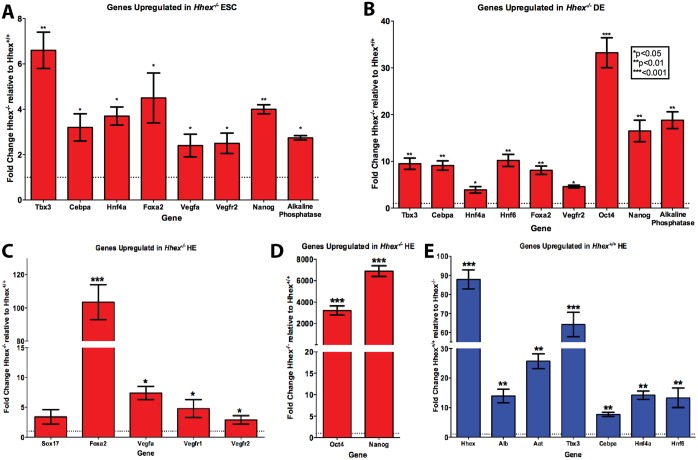
Fig 2. Genotype Comparison using QPCR at each Differentiation Stage.
Hhex-/- HE cells did not show mRNA expression consistent with hepatic differentiation. A-E) Comparison of fold-change in normalized mRNA gene expression using differentiation-stage specific markers. Comparison of pluripotency gene markers reveal Hhex-/- (red) cells showed increased pluripotency relative to Hhex+/+ (blue) at each differentiation stage, particularly during HE differentiation (A, B, and E). Comparison of definitive endodermal gene markers reveal Hhex-/- cells fail to exhibit significant decreases in definitive endodermal gene expression characteristic of HE differentiation (C), and as seen in Hhex+/+ HE cells. Hhex+/+ HE cells showed dramatic increase in hepatic gene expression (D), while Hhex-/- cells showed a heavily attenuated expression. Comparison of Vegf signaling gene markers showed that Hhex-/- cells exhibit increased levels of ligands (Vegf-a) and receptor (Vegfr1 and Vegfr2) gene expression at each differentiation stage, but particularly during HE differentiation (A, B, and C). (Note raw data is presented in S1 Fig) (*p<0.05, **p<0.01, and ***p<0.001).

