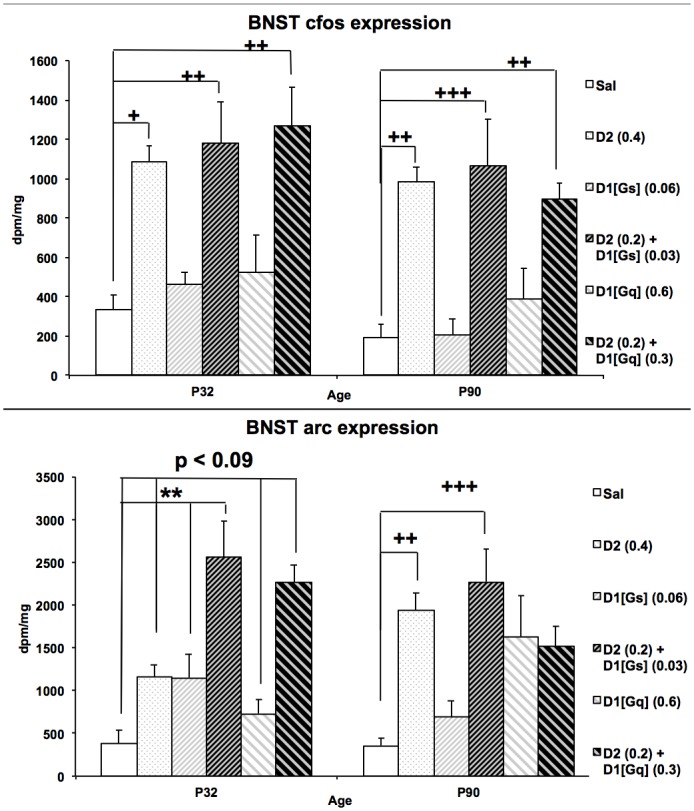
Fig 3. Age Differences in BNST IEG Synergy.

(A) Cfos expression in the BNST of animals treated with saline, agonist alone, or in combination (B) Arc expression in the BNST of animals treated with saline, agonist alone, or in combination ***p<0.001 vs. saline and additive doses of each agonist along at the same age. +p<0.05 vs. saline, ++p<0.01; n = 6–7 per group
