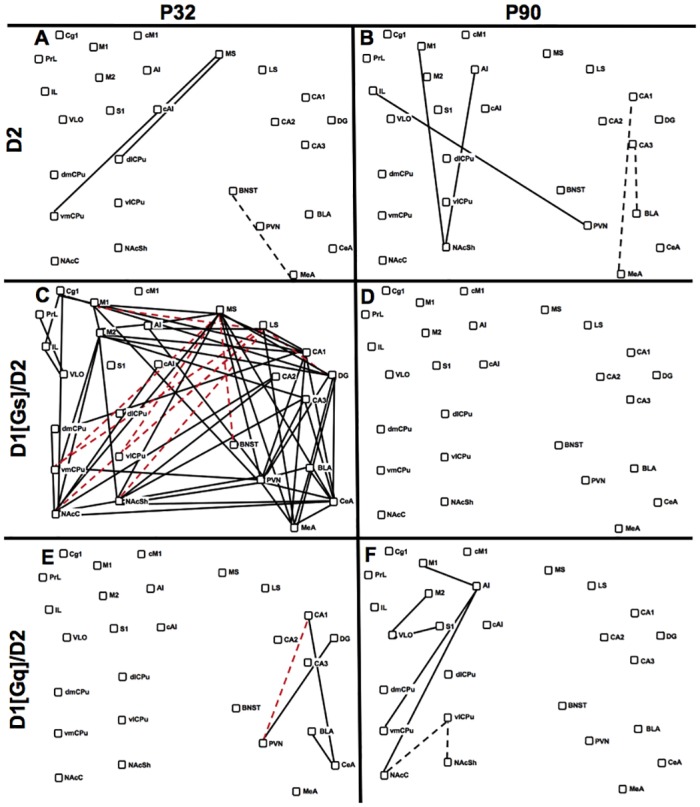
Fig 5. D1/D2-Induced Cfos Network Changes.

Difference maps visually represent significant differences between baseline networks in saline-injected controls and that in animals injected with D1/D2 drug combinations. Nodes represent brain regions and are presented in pseudoanatomical space. Lines indicate functional relationships between nodes that are significantly altered by D1/D2 treatment relative to controls (p<0.01, n = 6–7). Solid black lines indicate gain of a positive cfos CGE. Dashed black lines indicate loss of positive cfos CGE. Solid red lines indicate gain of negative cfos CGE. Dashed red lines indicate loss of negative CGE. (A) Effects of D2 stimulation in adolescents. (B) Effects of D2 stimulation in adults. (C) D1[Gs]/D2 combination treatment in adolescents. (D) Effects of D1[Gs]/D2 combination treatment in adults. (E) Effects of D1[Gq]/D2 combination treatment in adolescents. (F) Effects of D1[Gq]/D2 combination treatment in adults.
