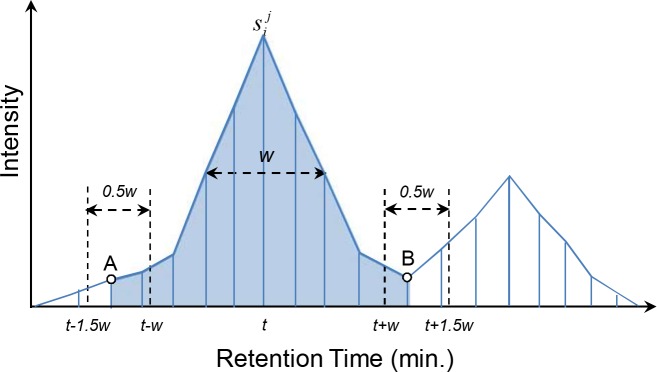
Fig 2. A cartoon for the illustration of constructing extracted ion chromatograms.
The blue straight lines represent the clustered signals, w and t are the FWHM and retention time of , respectively. Signal A and B are determined as the boundaries of the EIC, and the area in light blue color is the abundance.

