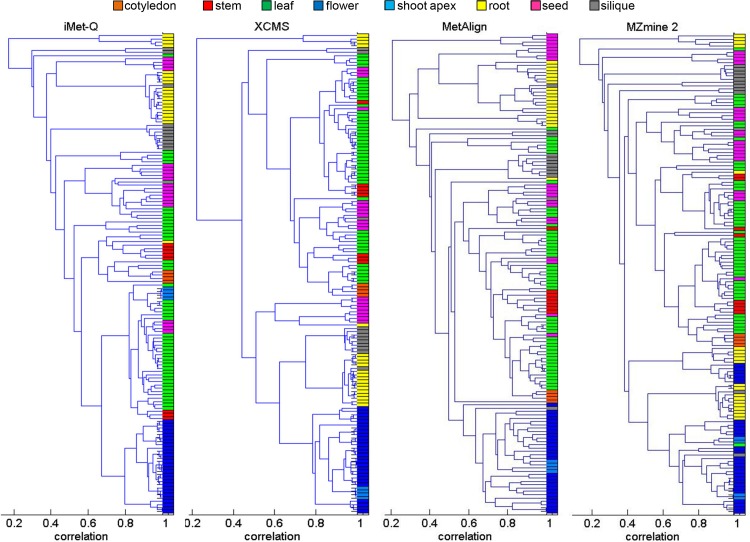
Fig 4. Hierarchical clustering by using the quantitation results of iMet-Q, XCMS, MetAlign, and MZmine 2.
Each entry in the tree leaves of a dendrogram represents a replicate. For each tool, we first combined its quantitation results of positive- and negative-ion modes. Colors were assigned to each replicate in the combined quantitation results according to the plant classes which the replicates originated from as follows: orange for cotyledon, red for stem, green for leaf, blue for flower, light blue for shoot apex, yellow for root, pink for seed, and gray for silique. Next, the figure was produced using MATLAB dendrogram function with PMMCC as the abundance correlation measure between any two replicates in the combined quantitation results.

