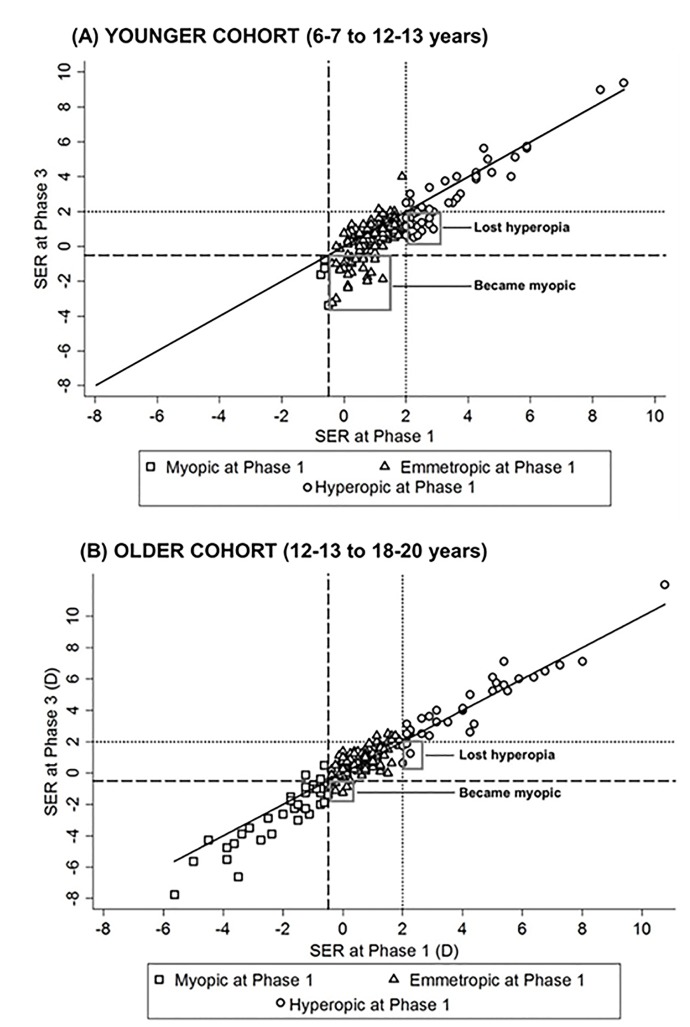
Fig 2. Scatterplots of SER at Phase 1 versus SER at Phase 3 for the younger and older cohorts respectively.
Data are grouped into refractive classifications as illustrated in the key. The gray boxes indicate participants who became myopic (younger cohort n = 27; older cohort n = 8) or lost their hyperopia (younger cohort n = 20; older cohort n = 4) between Phase 1 and 3. The dashed lines represent the myopia cut-off point of -0.50D or less and the dotted line represents the hyperopia cut-off of +2.00D or greater. The solid black line represents unity- those falling below the line are showing a myopic change in SER.

