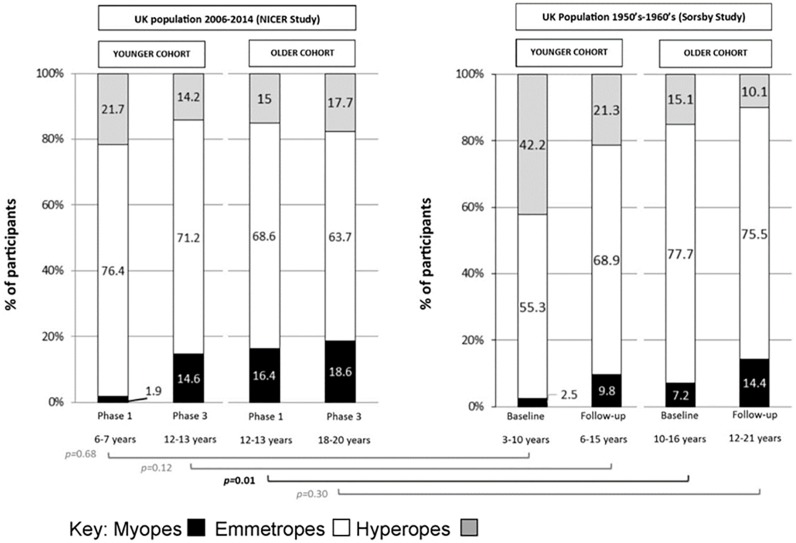
Fig 4. Comparison of UK refractive error distribution between 1950’s-1960’s (Sorsby study) and 2006–2014 (NICER study) at baseline and follow-up.
The brackets indicate the statistical comparisons of the proportions of myopes between the two studies; black indicates statistically significant difference, gray indicates no statistically significant difference (Two sample test of proportion).

