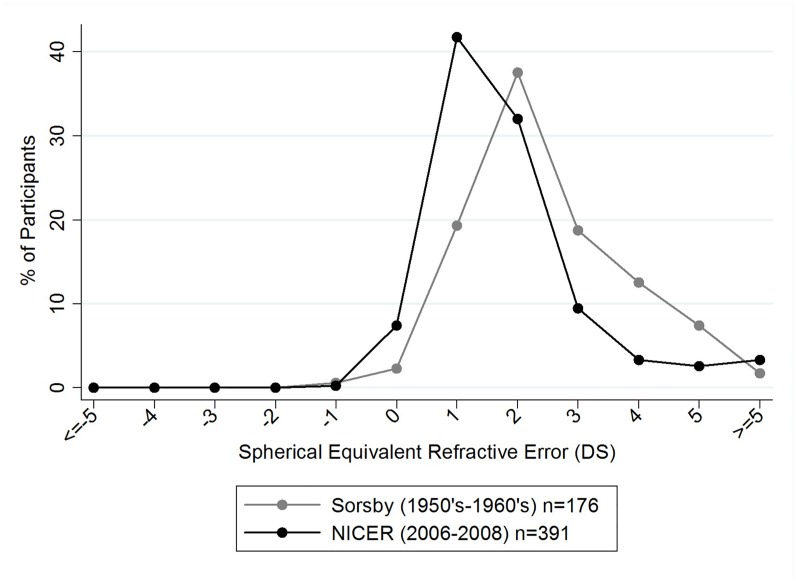
Fig 5. Distribution of spherical equivalent refractive errors in 6–7 year old children within the NICER study Phase 1 (2006–2008) and 6–7 year old children from Sorsby et al.[14].
Data points represent a one dioptre interval (for example, the % of participants represented at point 0 on the x-axis have an SER of less than or equal to 0DS but greater than -1 DS. Data points at the extremes of the x-axis represent participants with SER of greater than or equal to +5DS or less than or equal to -5DS.

