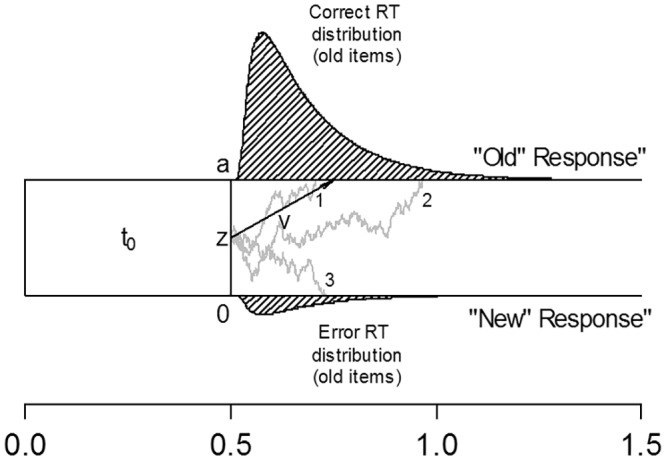
Fig 1. The Diffusion Model [17].

Illustration of the diffusion process for the classification of an “old” item as either “old” or “new”. The decision process starts at point z and moves toward the upper boundary or lower boundary by a drift rate ν. In this example, “old” response corresponds to the upper (and correct) boundary a, and is driven by a positive drift rate. Three sample paths are illustrated with responses 1 and 2 ending in a correct response at the upper boundary (“old”) but path 3 drifts toward the lower boundary 0, ending in an incorrect response “new”. RT = reaction time; t0 = perceptual motor RT.
