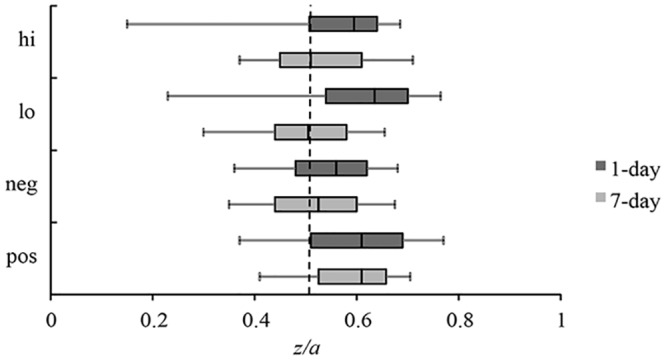
Fig 2. Response Bias (z/a).

Box plots of the distribution of response bias values for high and low-arousal items and negative and positive items at each lag. The line in each box represents the median. Response bias values above .5 (to the right of the dotted line) indicate a bias to classify items as “old”, whereas values below .5 indicate a bias to classify items as “new”. Error bars represent standard error. Hi = high-arousal items; Lo = low-arousal items; Neg = negative items; Pos = positive items; 1-day = 1-day study-test lag; 7-day = 7-day study-test lag.
