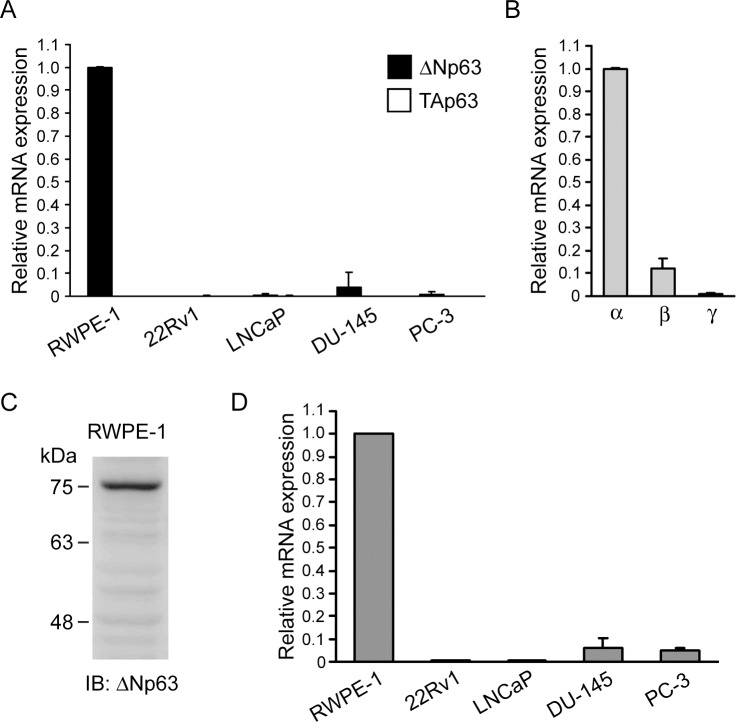
Fig 2. ΔNp63α is the predominant p63 isoform in prostate epithelial cells and its expression strikingly correlates with CTEN.
(A) qPCR analyses of the mRNA levels of TAp63 (□) and ΔNp63 (■) isoforms in prostate cell lines. The relative mRNA expression levels were represented as relative fold change compared to the mRNA abundance in RWPE-1 cells. Data are expressed as the mean±standard deviation of three different experiments analyzed in triplicate. (B) qPCR analyses of the mRNA levels of p63α, β and γ isoforms in RWPE-1 cells. The relative mRNA expression levels were represented as relative fold change compared to the mRNA abundance of α isoforms. Data are expressed as the mean±standard deviation of three different experiments analyzed in triplicate. (C) Total lysate (30 μg) of RWPE-1 cells was analyzed by western analysis using antibodies against ΔNp63 isoforms. (D) qPCR analyses of the mRNA levels of CTEN in prostate cell lines. The relative mRNA expression levels were represented as relative fold change compared to the mRNA abundance in RWPE-1 cells. Data are expressed as the mean±standard deviation of three different experiments analyzed in triplicate.

