. 2015 Oct 6;4:e10180. doi: 10.7554/eLife.10180

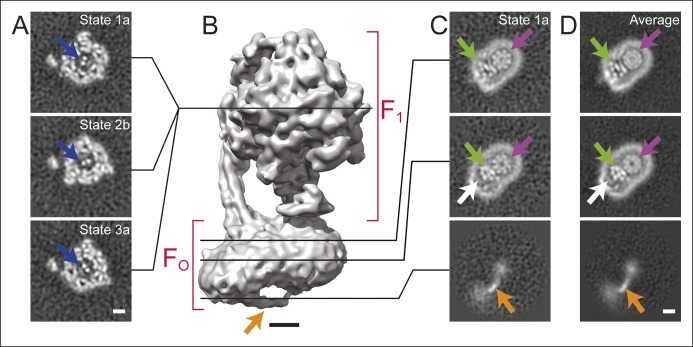
Figure 1. Cross-sections through maps.

(A) Cross-sections through the F1 regions of the different maps show that states 1, 2, and 3 are related by ∼120° rotations of the γ subunit within the α3β3 hexamer (blue arrows). (B) Surface rendering of a map (State 1a) shows the bent FO region with a tubular feature that extends from the rotor-distal portion to the c8-ring (orange arrow). (C) Cross-sections through the FO region show α-helices from the a, b and A6L subunits (green arrows), a low density region in the rotor-distal portion (white arrow), the tubular extension from the rotor-distal portion to the rotor (orange arrows), and the c-ring (purple arrows). (D) Averaging the FO regions from the seven different maps shows all of the features mentioned above with an improved signal-to-noise ratio for some features. Scale bars, 25 Å.

DOI: http://dx.doi.org/10.7554/eLife.10180.003

Figure 1.

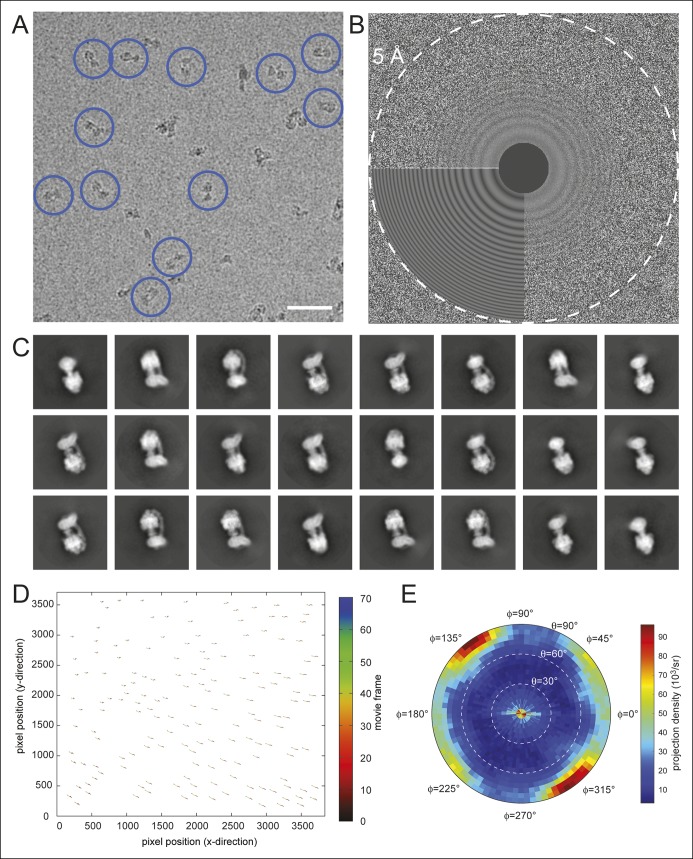
Figure 1—figure supplement 1. Electron microscopy and model construction.

Figure 1—figure supplement 1.

(A) A sample micrograph with representative ATP synthase particles circled in blue. Scale bar, 500 Å. (B) A sample micrograph power spectrum with the modeled power spectrum from CTFFIND4 in the lower left quadrant. (C) Representative averages from 2D classes selected for 3D analysis. (D) An example of individual particle trajectories (exaggerated by a factor of 5) from alignparts_lmbfgs used for local drift correction. (E) The distribution of Euler angles assigned to particles going into the 3D maps shows preferred orientations but contains sufficient particle views to produce maps with isotropic resolution.

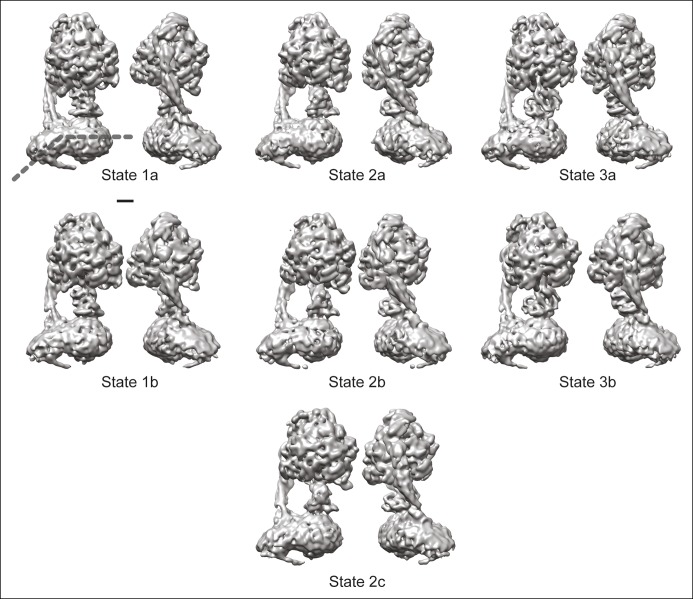
Figure 1—figure supplement 2. The seven observed states of the bovine mitochondrial ATP synthase.

Figure 1—figure supplement 2.

Two views are shown for each of the seven conformations identified for the enzyme. All of the known structural features and the newly observed protuberance from the rotor-distal portion of the FO region are seen in each map. The bend in the FO region is indicated by the dashed line in the top left map. Scale bar, 25 Å.

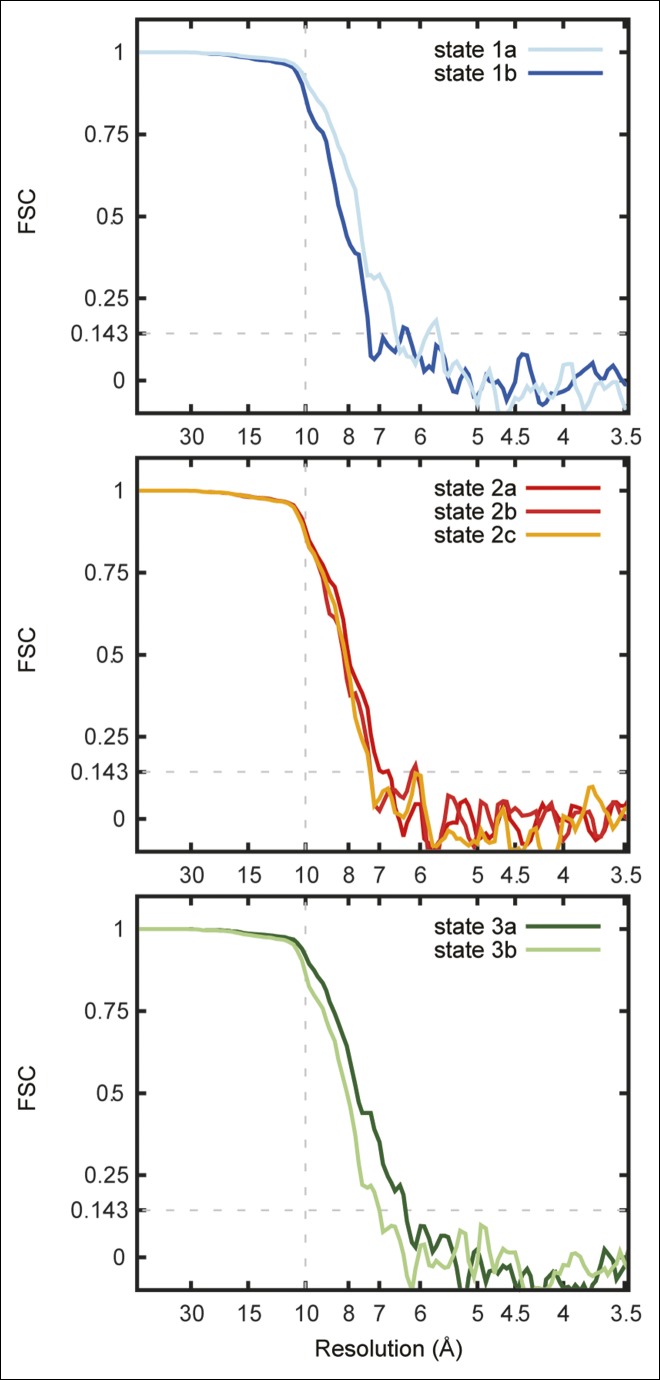
Figure 1—figure supplement 3. Fourier shell correlation curves for the seven maps.

Figure 1—figure supplement 3.

FSC curves are shown for state 1a and 1b (A), state 2a, 2b, and 2c (B), and state 3a and 3b (C).