. 2015 Nov 9;4:e10832. doi: 10.7554/eLife.10832

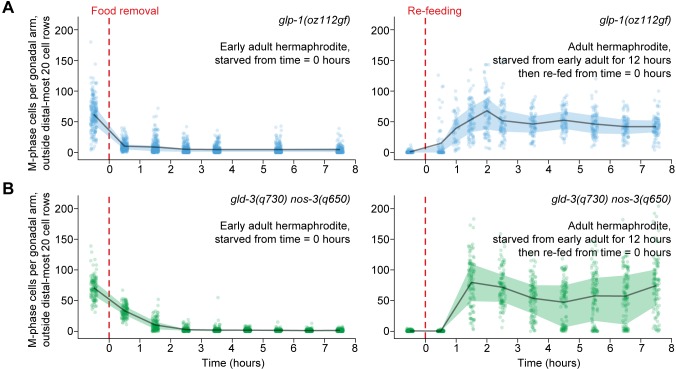
Figure 5. Ectopic mitotic divisions outside the progenitor zone respond normally to food removal and re-feeding.

Figure 5.

Time courses showing the number of M-phase cells—outside the distal-most 20 rows of germ cells—after food removal or re-feeding in adult glp-1(oz112gf) hermaphrodites or adult gld-3(q730) nos-3(q650) hermaphrodites. Time zero indicates the start of food removal or re-feeding. Lines connect means, and shaded areas show interquartile ranges. n = 50–249 gonadal arms per time point. Source data are available in Figure 5—source data 1.

DOI: http://dx.doi.org/10.7554/eLife.10832.016

Figure 5—source data 1. Counts of M-phase cells for starvation and re-feeding time courses of glp-1(oz112gf) and gld-3(q730) nos-3(q650) hermaphrodites.
This comma-separated value file contains counts of M-phase cells per gonadal arm for glp-1(oz112gf) and gld-3(q730) nos-3(q650) starvation and re-feeding time courses (Figure 5). Each row of the file represents a single gonadal arm. Descriptors include treatment group (starvation, re-feeding), genotype (glp-1(oz112gf), gld-3(q730) nos-3(q650)), and time.
DOI: 10.7554/eLife.10832.017