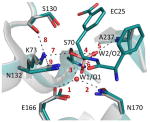
Table 4. The key interactions underlining TEM-1’s catalysis.
The figure below depicts a superposition of the key active site residues in free (gray, PDB:1ZG4 (ref. 38)) and bound (green, PDB: 4OQG) wild-type structures. The distances for the indicated bonds are provided in the table below.
| Interaction # | Interaction distances (Å) | ||||||||
|---|---|---|---|---|---|---|---|---|---|
| 1 | 2 | 3 | 4 | 5 | 6 | 7 | 8 | 9 | |
| Free enzyme | |||||||||
|
| |||||||||
| Wild-type | 2.5 | 2.8 | 2.8 | 2.4 | 3.2 | 2.9 | 2.8 | 3.0 | 2.7 |
|
| |||||||||
| R164S | 2.7 | 3.5 | 3.2 | 2.9 | 2.9 | 3.1 | 2.7 | 2.9 | 2.7 |
|
| |||||||||
| G238S | 2.5 |
2.3a 6.1 |
2.9 | 2.8 | 2.4 | 3.0 | 2.7 | 2.9 | 2.8 |
|
| |||||||||
| R164S/G238S | n.d. | n.d. | n.d. | 2.9 | 2.9 | 3.1 | 2.7 | 2.8 | 2.7 |
|
| |||||||||
| EC25-bound | |||||||||
|
| |||||||||
| Wild-type | 2.8 | 2.9 | 2.2 | 2.6 | 3.8 | 3.1 | 2.9 | 2.5 | 3.1 |
|
| |||||||||
| R164S | 2.5 | 2.6 | 2.6 | 2.5 | 2.8 | 2.8 | 2.8 | 2.8 | 2.6 |
|
| |||||||||
| G238S | 2.5 | 2.7 | 2.5 | 2.5 | 2.8 | 2.8 | 2.7 | 2.8 | 2.8 |
|
| |||||||||
| R164S/G238S | 2.5 |
2.7a 6.1 |
2.4 | 2.4 | 3.0 | 2.8 | 2.7 | 2.8 | 2.7 |
|
| |||||||||
| Acceptor | E166 Oε |
N170 Oδ |
n.a. | n.a. | W2/O2b | W2/O2b | K73 NζH3 |
S130 Oγ |
N13 2 Oδ |
|
| |||||||||
| Donor | W1/O1c | W1/O1c | n.a. | n.a. | A237 Nα |
S70 Nα |
S70 Oγ |
K73 NζH3 |
K73 NζH3 |
|
| |||||||||

| |||||||||
n.d. – Not detected: the interaction is not observed because at least one of the interacting TEM-1 side-chain atoms is disordered.
n.a. – not applicable. These contacts are not hydrogen bonds.
N170 appears in two alternative conformations in this structure.
The oxyanion hole water or the borate oxygen atom mimicking it.
The de-acylating water or the borate oxygen atom mimicking it.
Table 4’s figure: TEM-1’s active-site configuration
