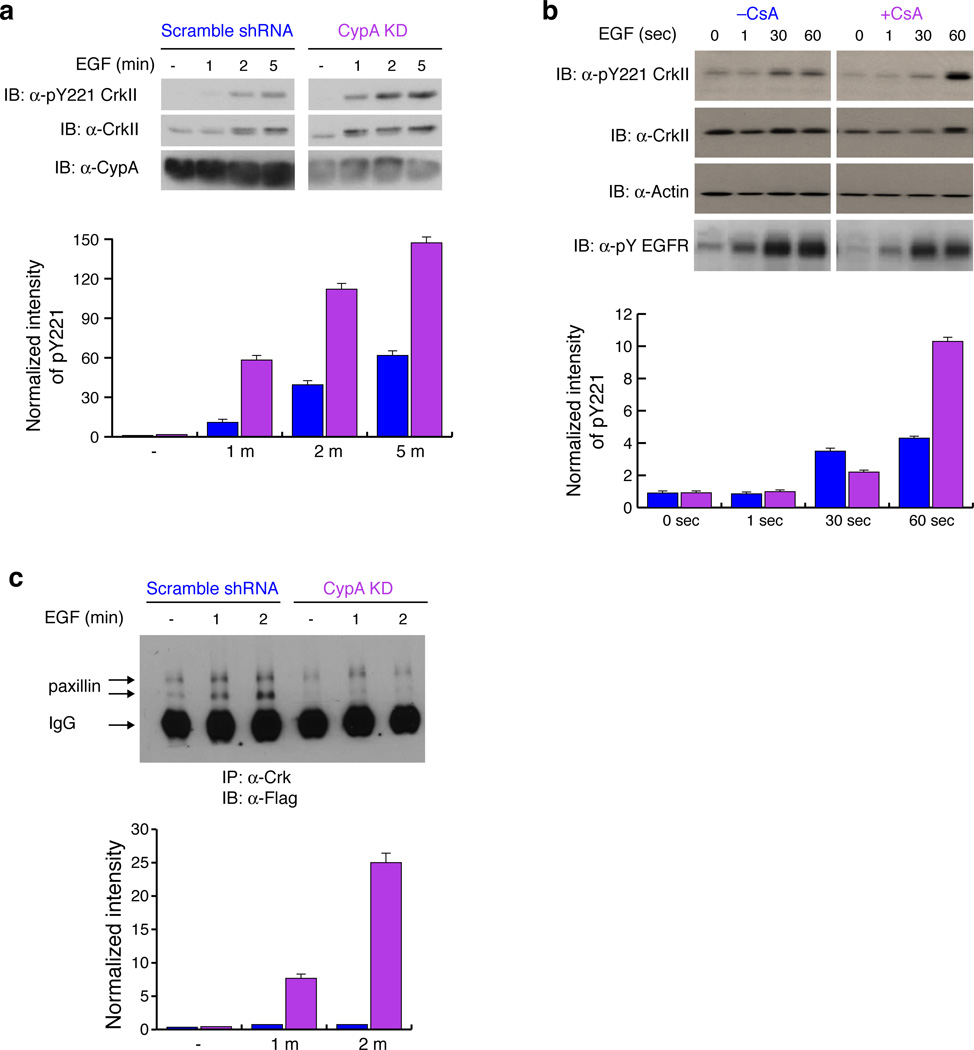
Figure 4. CypA attenuates CrkII Tyr221 phosphorylation cancer cell line MDA-MB-468.
(a) Effect of CypA on CrkII Tyr221 phosphorylation was measured upon EGF stimulation in MDA-MB-468 cells. Lysates were analyzed by western blotting with the antibodies indicated. The intensity of the bands (top) was quantified and pTyr221 CrkII phosphorylation levels were normalized to overall CrkII expression and plotted (bottom). Full gels are shown in Supplementary Fig. 13. Scrambled shRNA (blue) and CypA-KD (magenta). (b) Effect of CsA on CrkII Tyr221 phosphorylation was investigated in MDA-MB-468 cells pretreated with DMSO or CsA and stimulated with EGF for the times indicated, and lysates analyzed for CrkII Tyr221 phosphorylation. The intensity of the bands (top) was quantified and pY221 CrkII phosphorylation levels were normalized to overall CrkII expression and plotted (bottom). Full gels are shown in Supplementary Fig. 13. Without CsA (blue) and with CsA (magenta). (c) Effect of CypA on paxillin-CrkII complex formation was investigated in MDA-MB-468 cells stably expressing scrambled shRNA or CypA shRNA transiently transfected with flag-paxillin and stimulated with EGF for 1 and 2 minutes. Immunoprecipitation of CrkII from lysates was analyzed with anti-flag antibody. The intensity of the bands (top) representing paxillin were quantified, normalized against the paxillin level in untreated cell line expressing CypA shRNA and plotted (bottom). Scrambled shRNA(blue) and CypA-KD (magenta). The two bands of paxillin represent differentially phosphorylated forms of paxillin. All experiments were analyzed by western blotting. Full gels are shown in Supplementary Fig. 13. For all graphs data represents the results from 3 independent experiments. (±SEM)

