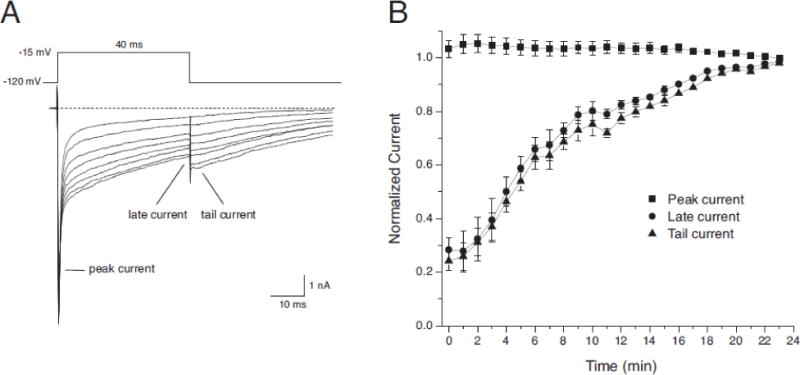
Fig. 2.

Time course of modification of Naa1.6 channels during perfusion with 1 μM tefluthrin. (A) Currents recorded from a representative cell at 3-min intervals (0–21 min) during perfusion with 1 μM tefluthrin showing the time-dependent increase in the tefluthrin-induced late and tail currents. (B) Time course of modification of Nav1.6 channels by 10 μM tefluthrin from multiple experiments such as that shown in panel A. Peak, late and tail current amplitudes for each cell were normalized to the amplitude of the corresponding current recorded after 23 minutes. Each data point is the mean of 9 experiments with different cells; bars show SE values larger than the data point symbols.
