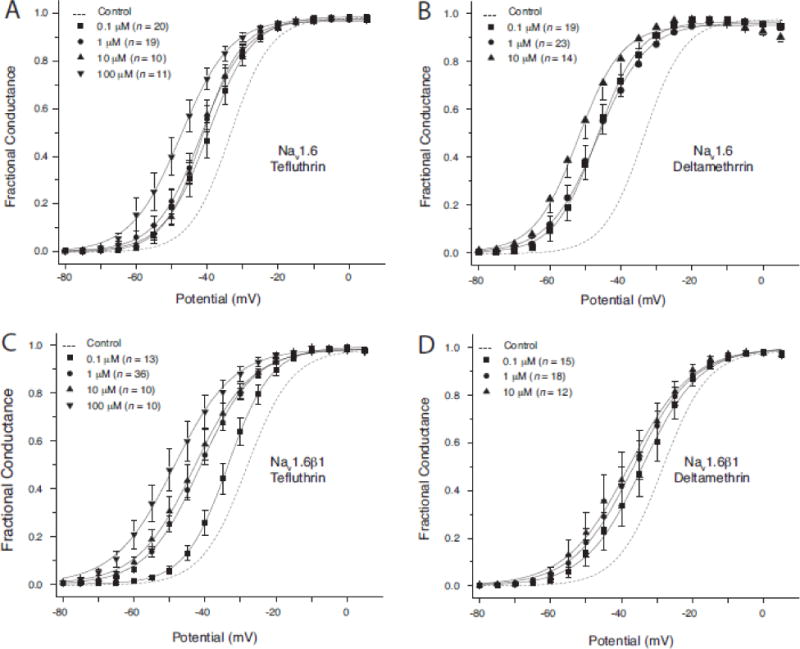
Fig. 4.

Concentration-dependent modification of the voltage dependence of activation of sodium channels in HEK-Nav1.6 (A, B) and HEK-Nav1.6β1 (C, D) cells by tefluthrin (A, C) and deltamethrin (B, D). Values for the conductance of peak sodium current were plotted as a function of test potential and curves were drawn by fitting mean values to the Boltzmann equation. Values are the means of the indicated number of determinations with different cells; bars show SE values larger than the data point symbols. Dashed lines show the curve obtained by fitting mean control values to the Boltzmann equation (He and Soderlund, 2014).
