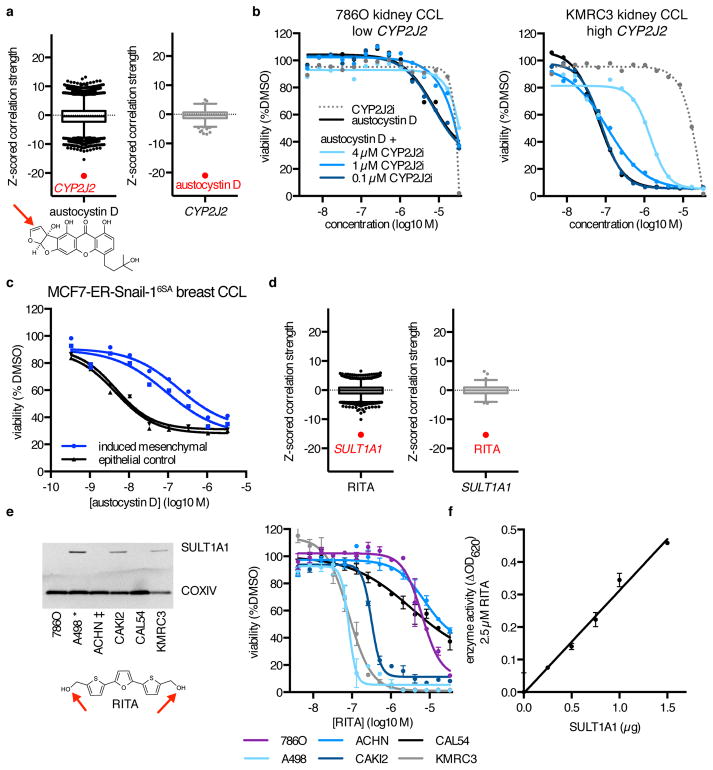
Figure 2. MoA Analysis Reveals New Mechanisms of Small-Molecule Metabolism.
(a) Expression–sensitivity correlations for the compound austocystin D and CYP2J2 expression. Reactive functionalities are depicted with a red arrow. (b) Cytotoxicity of austocystin D and a selective CYP2J2 inhibitor (CYP2J2i) across renal CCLs with different expression levels of CYP2J2, and effects of co-treatment of austocystin D with CYP2J2i. Cell viability values are normalized to vehicle-only (DMSO) treatment, with each point representing the mean of n = 2 independent experiments with 2 technical replicates each. (c) Cytotoxicity of austocystin D in MCF7-ER-Snail-16SA cells either induced to undergo epithelial-to-mesenchymal transition (blue) or vehicle-treated (black). Each point is the mean of n = 2 technical replicates. Two independent inductions are shown. (d) Expression–sensitivity correlations for the compound RITA and SULT1A1 expression. (e) Protein expression of SULT1A1 and sensitivity to RITA of six renal CCLs. CCLs described in ref. 23 as capable (*) or incapable (‡) of metabolizing RITA into a cytotoxic form are indicated. Each point is mean ± s.d. for n = 3 independent experiments. For uncropped gel image, see Supplementary Figure 8b. (f) Sulfotransferase enzyme activity of varying amounts of recombinant SULT1A1 at a fixed concentration of RITA in the presence of the sulfate donor 3′-phosphoadenosine-5′-phosphosulfate. Each point is mean ± s.d. for n = 3 independent experiments.

