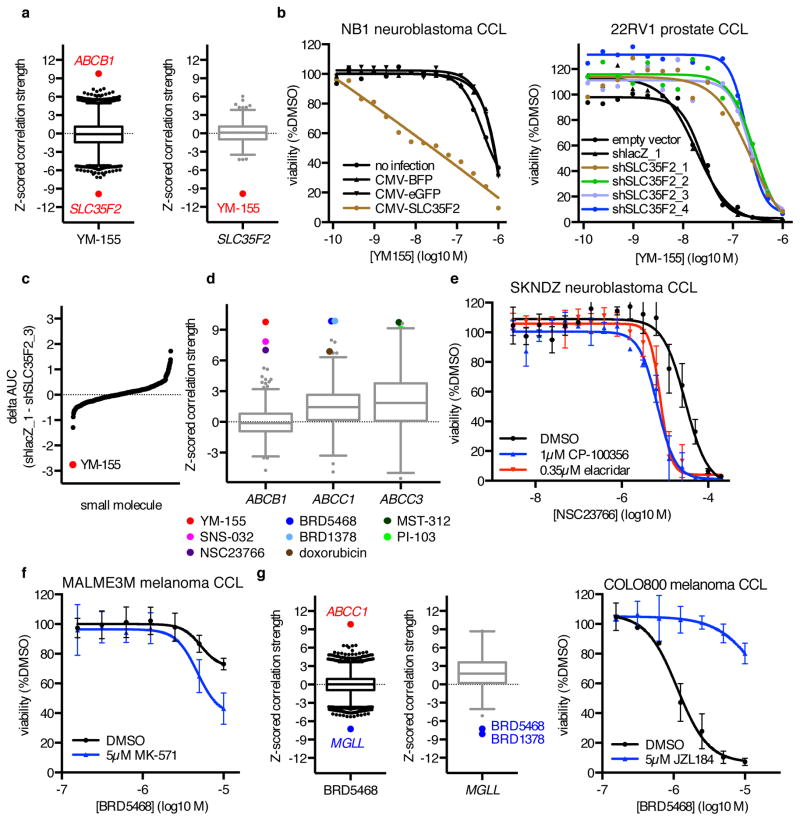
Figure 3. MoA Analysis Reveals Small-Molecule Transport Mechanisms.
(a) Expression–sensitivity correlations for YM-155 and SLC35F2. (b) Effects of SLC35F2 overexpression in NB1 cells, or of SLC35F2 knockdown in 22RV1 cells, on YM-155 cytotoxicity. Each point represents the mean of n = 2 independent experiments with 3 (22RV1) –4 (NB1) technical replicates each. (c) Difference in 8-point AUC values between 22RV1-shlacZ_1 and 22RV1-shSLC35F2_3 cells for 439 small molecules tested in duplicate. (d) Expression–sensitivity correlations for multidrug resistance genes implicated by MoA analysis. (e) Effects of co-treatment with DMSO, the ABCB1 inhibitor CP-100356, or the ABCB1 inhibitor elacridar on NSC23766 cytotoxicity in SKNDZ cells. (f) Effects of co-treatment with DMSO or the ABCC1 inhibitor MK-571 on BRD5468 cytotoxicity in MALME3M cells. (g) Expression–sensitivity correlations for BRD5468 and MGLL, and effects of co-treatment with DMSO or the MGLL inhibitor JZL184 on BRD5468 cytotoxicity in COLO800 cells. For (e–g), each point is mean ± s.d. for n = 3 independent experiments.

