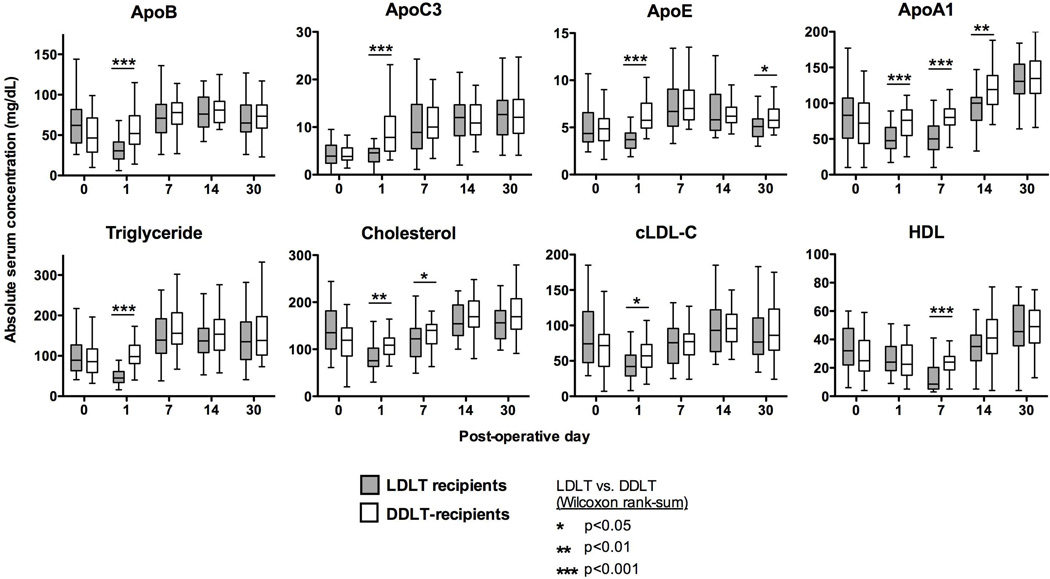
Figure 1. Absolute serum lipid levels for DDLT and LDLT recipients.
Serum lipid levels are shown as Tukey plots for each of the 5 measured timepoints in DDLT and LDLT recipients. Significant differences between the groups are noted with an asterisk; however, for visual simplification we have not included notation for significant differences within each group (example: LDLT day 0 vs. LDLT day 1). Abbreviations: cLDL = calculated low density lipoprotein.

