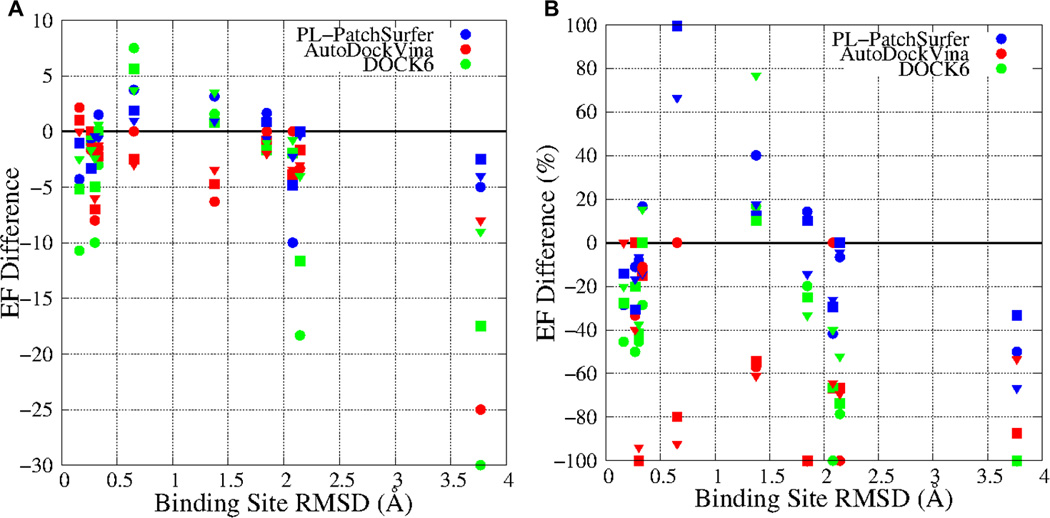
Figure 3.

Differences of enrichment factor for holo and apo forms. A, Enrichment factor differences between the holo form and the apo form structure (y-axis, EFapo-EFholo) as a function of binding site Ca-RMSD (x-axis). B, the ratio of enrichment factor difference relatvie to the enrichment factor fo the holo form (y-axis, (EFapo-EFholo)/EFholo) as a function of Ca-RMSD (x-axis). PL-PatchSurfer, AutoDockVina, and DOCK6 are colored in blue, red, and green, respectively. The circle, square, and triangle represent EF1%, EF2%, and EF5%.
