
Figure 2.
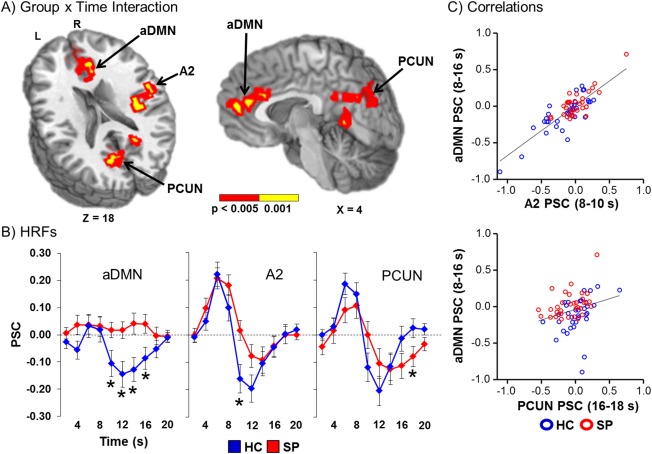
Panel A displays the regions of the brain showing a significant Group x Time (0 − 20 s post‐stimulus onset) interaction (red: significant at P < 0.005; yellow: P < 0.001). Locations of the sagittal (X) and axial (Z) slices are given according to the Talairach atlas for the left (L) and right (R) hemispheres. These areas included regions of the anterior default‐mode network (aDMN); right secondary auditory cortex (A2); and the bilateral precuneus (PCUN). Panel B displays the percent signal change (PSC) by group (healthy controls (HC) shown in blue and patients with schizophrenia (SP) in red) for the entire HRF. Time‐points (sampled at 2 s intervals) exhibiting significant differences during simple effect testing are indicated with an asterisk (*). Panel C illustrates the significant relationships between aDMN activity with other regions (A2 and PCUN) exhibiting a significant interaction effect.