Figure 2.
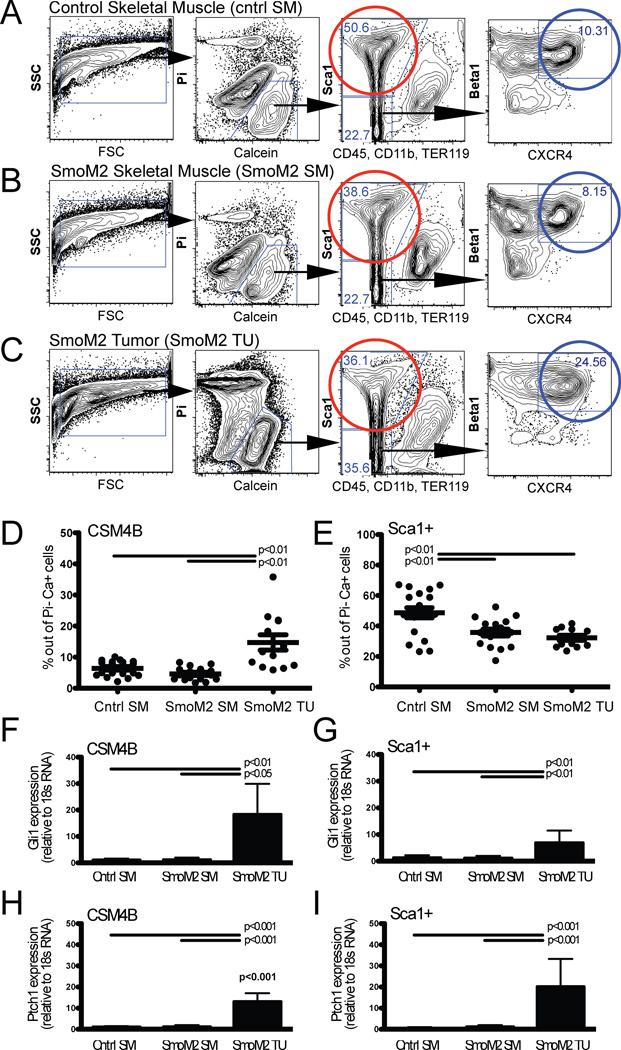
SmoM2 tumor cells exhibit immunophenotypic heterogeneity similar to normal mouse skeletal muscle. (A–C) Combinatorial staining for cell surface markers followed by fluorescence-activated cell sorting allows prospective isolation of phenotypically distinct cell populations from (A) control muscle (cntrl SM, isolated from R26-SmoM2(+/+) or R26-SmoM2(+/−) muscle), (B) SmoM2 muscle (SmoM2 SM, isolated from tamoxifen-induced R26-SmoM2(+/−);CAGGS-CreER muscle that was free of macroscopic tumors) and (C) SmoM2 tumor tissue (SmoM2 TU; isolated from R26-SmoM2(+/−);CAGGS-CreER muscle tumors). Data are presented as two-dimensional contour plots with nested gating as indicated by the black arrows. In normal muscle, CD45-Sca1-Mac1-CXCR4+β1-integrin+ (CSM4B) cells (blue gate) are enriched for PAX7-expressing satellite cells with myogenic precursor function [11, 1], and CD45-Sca1+ cells (red gate) are enriched for non-myogenic, adipogenic precursors [10, 3, 31]. Plots depict representative flow plots and are quantified in (D, E). (D, E) The frequency of CSM4B and Sca1+ cells was quantified by flow cytometry as percentage of Pi−Ca+ live cells in A–C. Individual data points, representing 12–14 individual mice, are presented as dots and are overlaid with mean +/− SD. P values indicate statistically significant differences and were calculated using Bonferroni’s correction for multiple comparisons. (D) The relative proportion of CSM4B cells was significantly increased, whereas (E) the relative proportion of Sca1+ fibroadipogenic stromal cells was reduced in SmoM2 tumor tissue compared to tumor-free SmoM2 and control muscle. (F–I) Increased expression of Hh targets Gli1 (F–G) and Ptch1 (H–I) in freshly sorted CSM4B and Sca1+ tumor cells was evaluated by qPCR. Data are presented as mean +/− SD and represent 7–9 independent experiments with 2–4 individual mice analyzed per experimental group in each experiment. P values indicate statistically significant differences and were calculated using Bonferroni’s correction for multiple comparisons.

