
Figure 6.
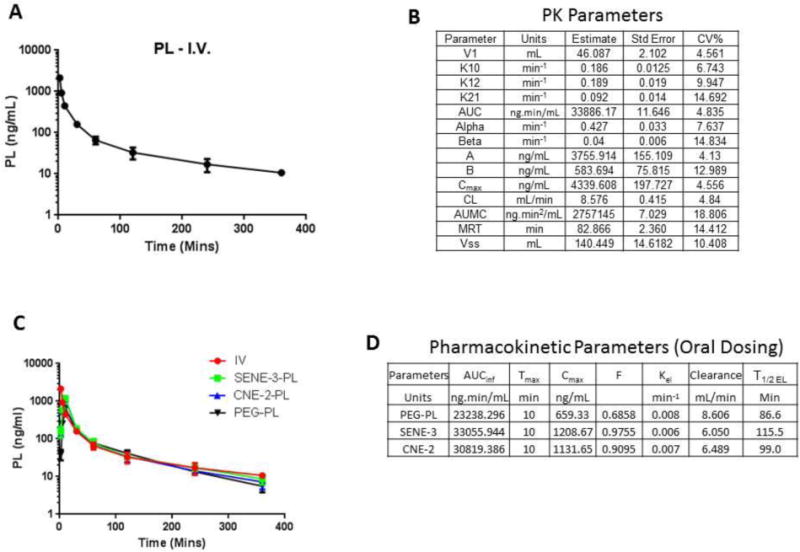
(A) Plasma Concentration vs. Time profile of PL after intravenous administration at a dose of 10 mg/kg in C57-BL/6 mice. (B) Values of the pharmacokinetic parameters along with standard error and %CV of PL evaluated by two-compartment model using WinNonlin. (C) Concentration vs. Time profile of free PL and PL loaded nanoemulsion administered orally at a dose of 10 mg/kg. (D) Values of the pharmacokinetic parameters calculated based on Concentration vs. Time profile obtained upon oral administration of free PL or PL loaded nanoemulsions.