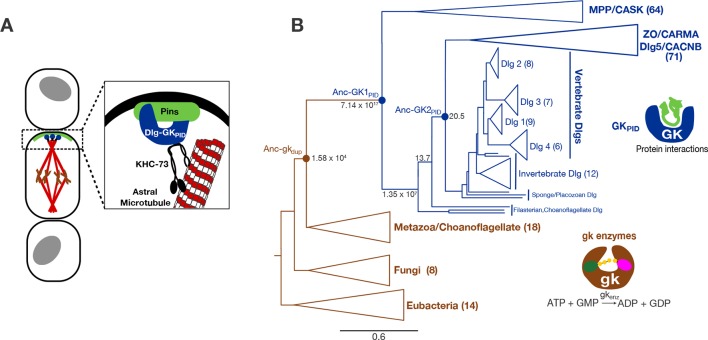
Figure 1. Function and phylogeny of the guanylate kinase (gk) and GKPID protein family.
(A) The GKPID of the protein Discs-large (Dlg, blue) serves as a scaffold for spindle orientation by physically linking the localized cortical protein Pins (green) to astral microtubules (red) via the motor protein KHC-73 (black). (B) Reduced phylogeny of the protein family containing gk enzymes (brown) and protein-binding GKPIDs (blue). Parentheses show the number of sequences in each clade. Reconstructed proteins Anc-gkdup (the preduplication ancestor of gk enzymes and GKPIDs in animals/choanoflagellates), Anc-GK1PID and Anc-GK2PID (the GKPID in the common ancestor of animals and choanoflagellates, and of animals, respectively) are marked as circles with approximate likelihood ratio support. Scale bar indicates number of substitutions per site. For unreduced phylogeny, see Figure 1—figure supplement 1. Characteristics of the reconstructed sequences are found in Figure 1—figure supplement 2. For sequences analyzed, see Figure 1—source data 1. For sequences and posterior probabilities of amino acid states, see Figure 1—source data 2, Figure 1—source data 3.
DOI: http://dx.doi.org/10.7554/eLife.10147.003
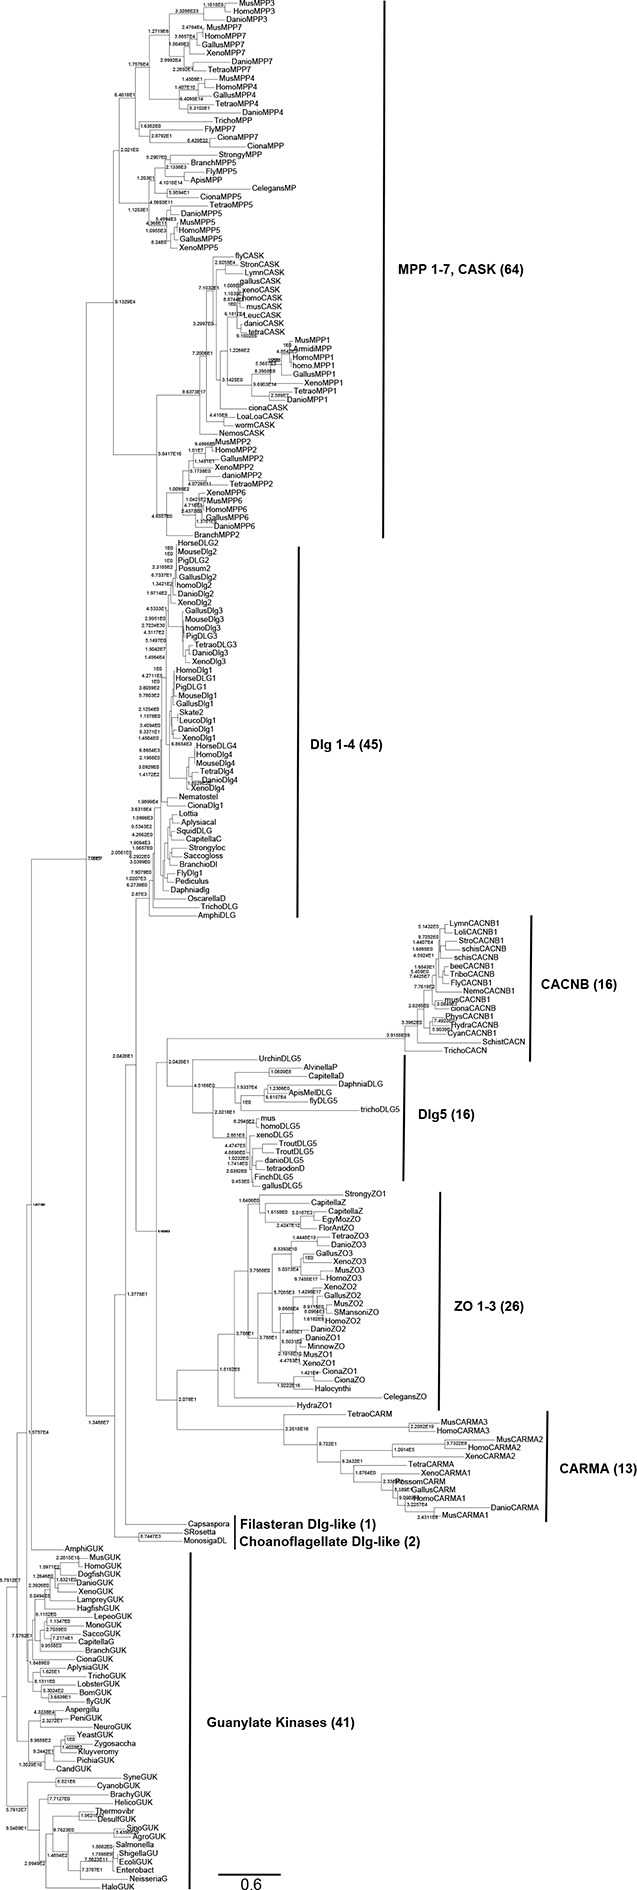
Figure 1—figure supplement 1. Complete phylogeny of 224 guanylate kinase enzyme and GKPIDs.

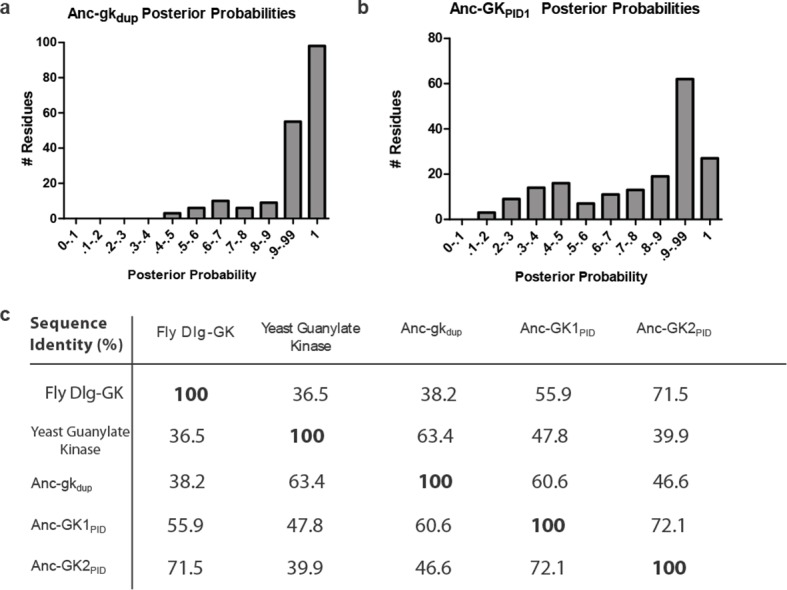
Figure 1—figure supplement 2. Sequence characteristics of maximum likelihood reconstructions of Anc-gkdup and Anc-GK1PID.


