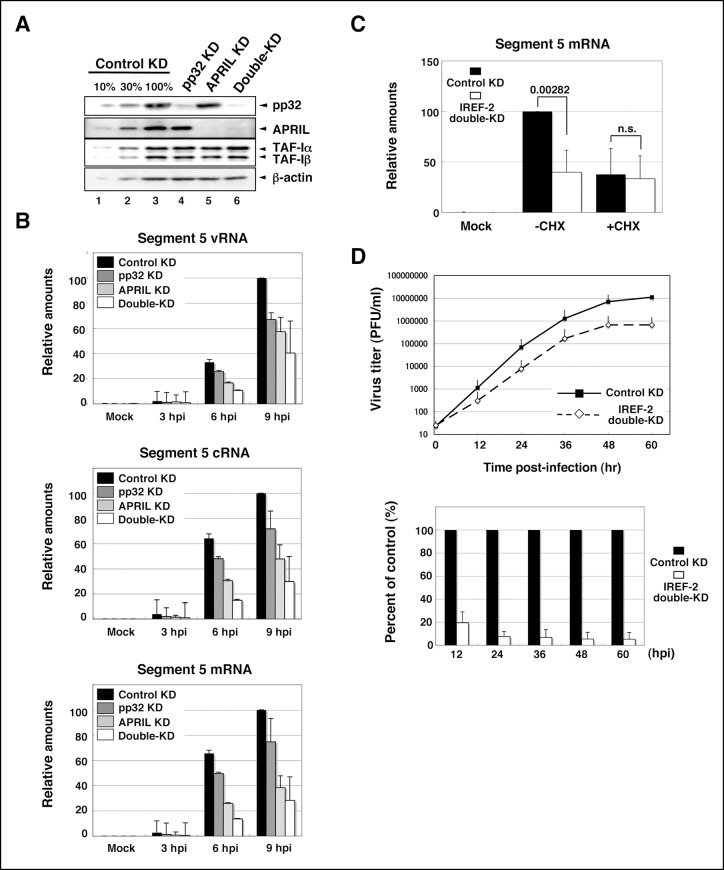
Figure 5. Effect of influenza virus replication factor-2 (IREF-2) knockdown in infected cells.
(A) Endogenous IREF-2 protein levels in knockdown (KD) HeLa cells. The whole-cell lysates of control KD cells (lane 3), pp32 KD cells (lane 4), APRIL KD cells (lane 5), and both pp32 and APRIL KD cells (termed double-KD cells; lane 6) were subjected to SDS-PAGE followed by western blot analysis with antibodies, as indicated on the right side of the panel. To measure the KD levels, 10% and 30% of the lysates of the control KD cells were also subjected to SDS-PAGE followed by western blot analysis with antibodies, respectively (lanes 1 and 2). (B) Viral RNA levels in infected KD HeLa cells. Total RNA was extracted from mock-infected or infected KD cells at an multiplicity of infection (MOI) of 1 at 3, 6, and 9 hr post infection. vRNA, complementary RNA(cRNA), and viral mRNA derived from segment 5 were quantitatively determined by RT-mediated qPCR (RT-qPCR), as described in 'Materials and methods'. (C) Primary transcription level in infected KD HeLa cells. Total RNA was extracted from mock-infected or infected KD cells at an MOI of 10 for 3 hr in the presence or absence of cycloheximide (CHX). Viral mRNA derived from segment 5 was quantitatively determined by RT-qPCR. (D) Effect of IREF-2 on progeny virus production. Control KD and IREF-2 double-KD A549 cells were infected with FluV (WSN/33 strain) at an MOI of 0.001. The number of infectious progeny viruses produced from control KD and IREF-2 double-KD A549 cells at each time point were plotted (upper panel), and the ratios of progeny viruses produced from IREF-2 double-KD A549 cells compared with those from control KD cells were also represented as a percentage of the control (lower panel). Each quantitative result is presented as the average with the standard deviation from at least three independent experiments. Significance was determined using Student’s t test. n.s.: not significant.


