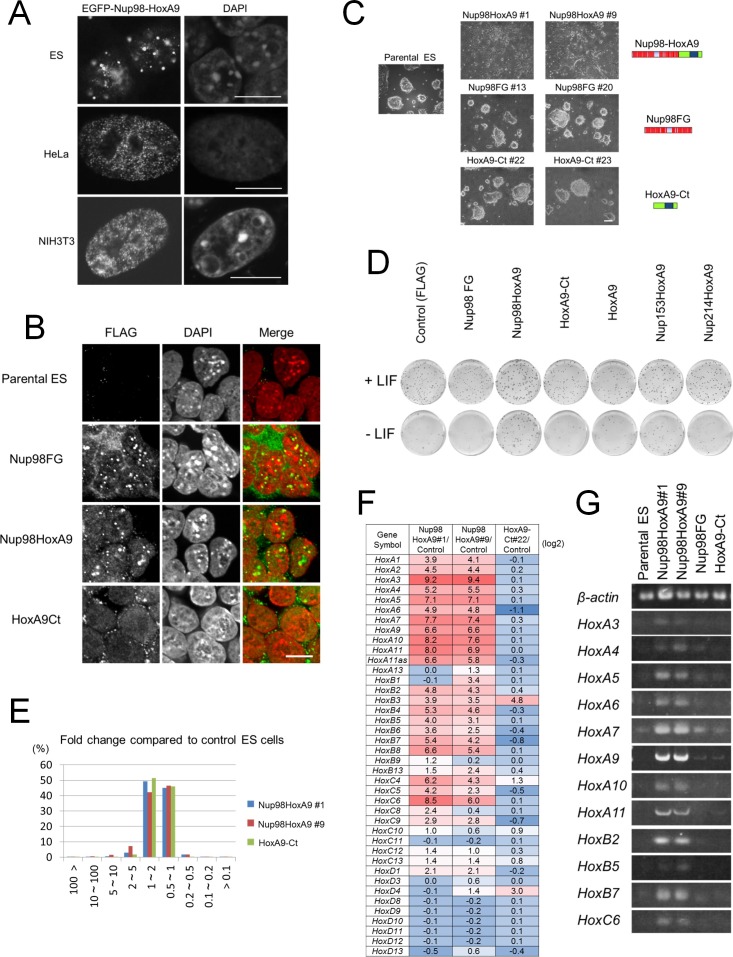
Figure 2. Nup98-HoxA9 evokes the expression of Hox cluster genes in ES cells.
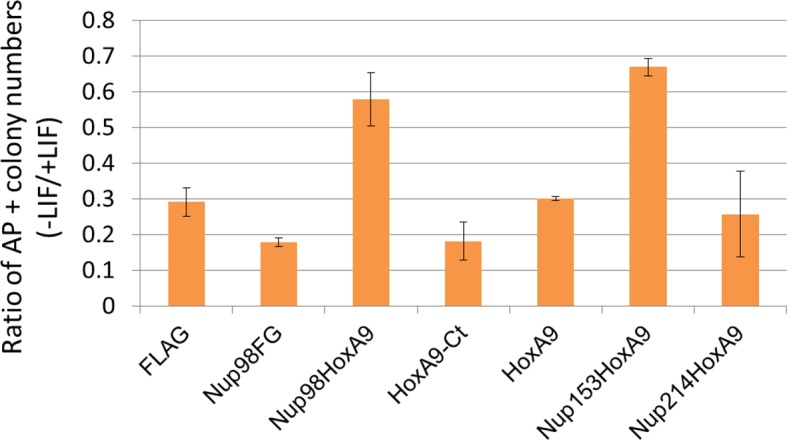
(A) Differential intranuclear localization of Nup98-HoxA9 in mouse ES, HeLa and NIH3T3 cells. Cells were transfected with the EGFP-Nup98-HoxA9 expressing plasmid for 24 hr, fixed, and stained with DAPI. Samples were analyzed using confocal microscopy. Bar, 10 μm. (B) Subcellular localization of Nup98-HoxA9 and its truncated mutants in ES cells. ES cell clones expressing FLAG-tagged Nup98FG, Nup98-HoxA9, or HoxA9-Ct were fixed and stained with an anti-FLAG (polyclonal) antibody. Nuclei were stained with DAPI. Merged images show FLAG staining (green) and DAPI (red). Bar, 10 μm. (C) Cell morphology of stable ES cell lines expressing FLAG-tagged Nup98-HoxA9, Nup98FG, or HoxA9-Ct. Bar, 100 μm. (D) Differentiation assay of stable ES cell clones. ES cells stably expressing FLAG (control), FLAG-tagged Nup98FG, Nup98-HoxA9, HoxA9-Ct, HoxA9, Nup153-HoxA9, or Nup214-HoxA9 were plated at a density of 103 cells per well in 12-well plates either in the presence or absence of LIF. After 5 d, the plates were fixed and stained with alkaline phosphatase, a marker for undifferentiated stem cells. (E) Gene expression profiling of ES cell lines stably expressing FLAG-tagged Nup98-HoxA9 (#1 and #9; two independent clones) and HoxA9-Ct is compared with that of parental ES cells. A greater than 10-fold upregulation of gene expression was commonly observed in both Nup98-HoxA9 clone #1 and Nup98-HoxA9 clone #9 cells. (F) Hox gene expression profiling. The log2 fold ratios of the normalized signal value of Hox cluster genes from Nup98-HoxA9 or HoxA9-Ct expressing ES cells relative to signals from parental control ES cells are indicated. (G) Upregulation of Hox cluster genes in FLAG-Nup98-HoxA9 expressing ES cell lines was confirmed using semi-quantitative polymerase chain reaction. DAPI, 4',6-diamidino-2-phenylindole; EGFP, enhanced green fluorescent protein; ES, embryonic stem; LIF, leukemia inhibitory factor
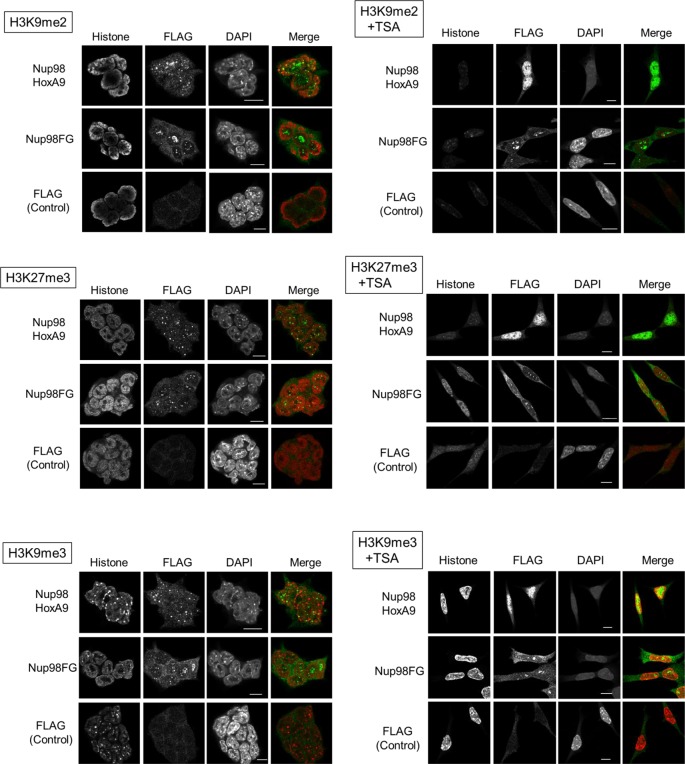
Figure 2—figure supplement 1. Co-staining of Nup98-HoxA9 with various histone marks.
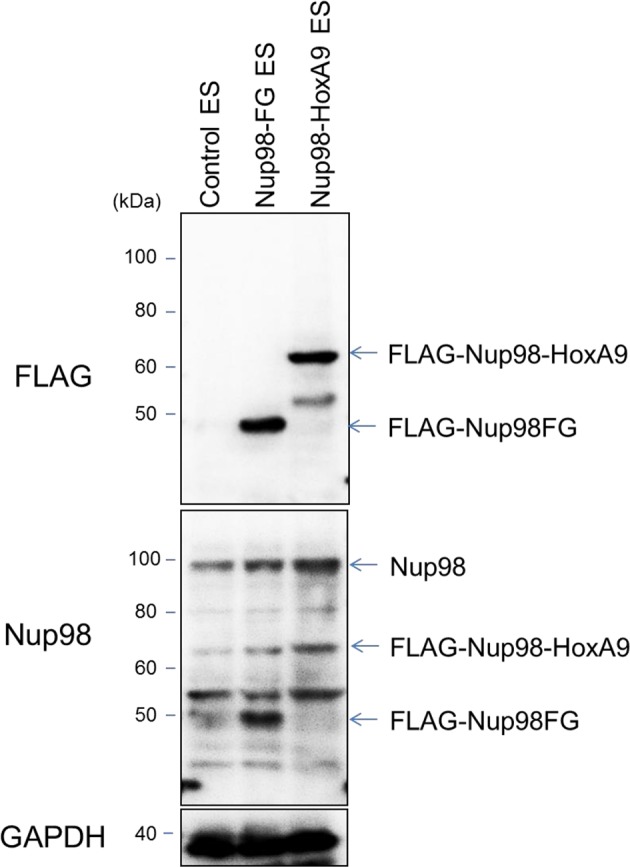
Figure 2—figure supplement 2. Protein expression levels of Nup98-HoxA9 and Nup98FG.

Figure 2—figure supplement 3. Differentiation assay of stable embryonic stem cell clones.


