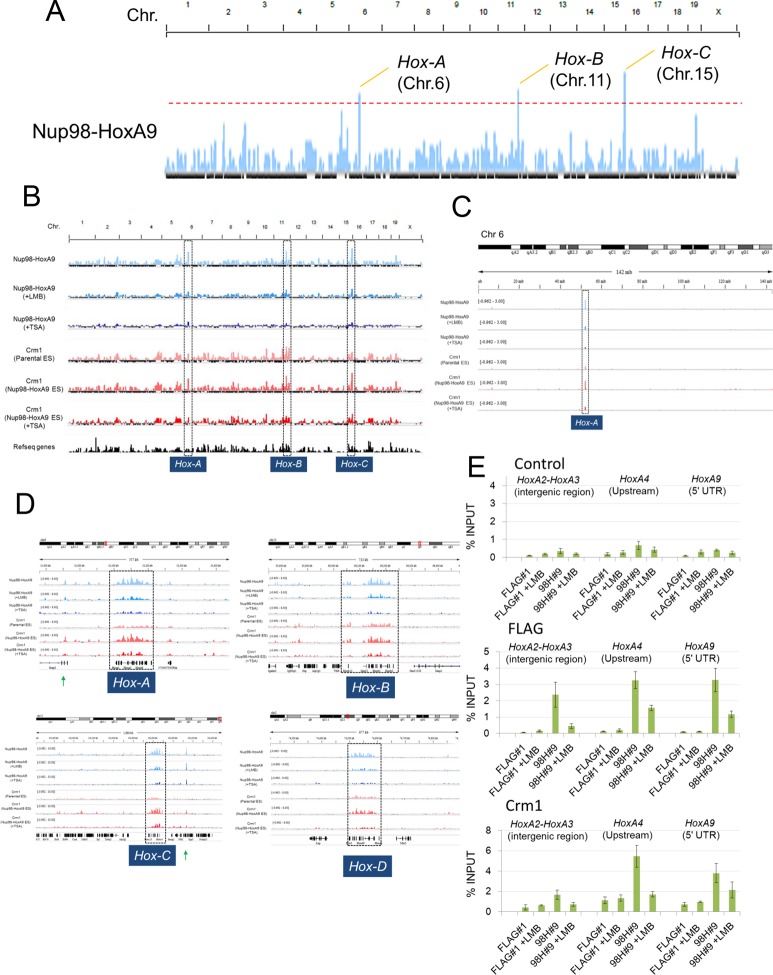
Figure 5. Nup98-HoxA9 is highly selectively targeted to Hox cluster regions through the chromatin-associated Crm1.
(A–D) ChIP-seq analysis of Nup98-HoxA9 or Crm1 (A, B: whole genome; C: chromosome 6; D: Hox cluster regions). The parental ES or Nup98-HoxA9 ES cells were cultured either in the absence or presence of LMB (5 nM, 2 hr) or TSA (50 nM, 24 hr) and used for ChIP-seq analysis. Also in (D) are regions that show Crm1 signals only when Nup98-HoxA9 is expressed (eg. green arrows point to regions next to Hox-A and Hox-C). (E) ChIP-qPCR analysis of FLAG-Nup98-HoxA9 and Crm1. Data are mean values ± standard error of the mean of three independent experiments. ChIP-seq, ChIP sequencing; ES, embryonic stem; LMB, leptomycin B; qPCR, quantitative polymerase chain reaction; TSA, trichostatin A.
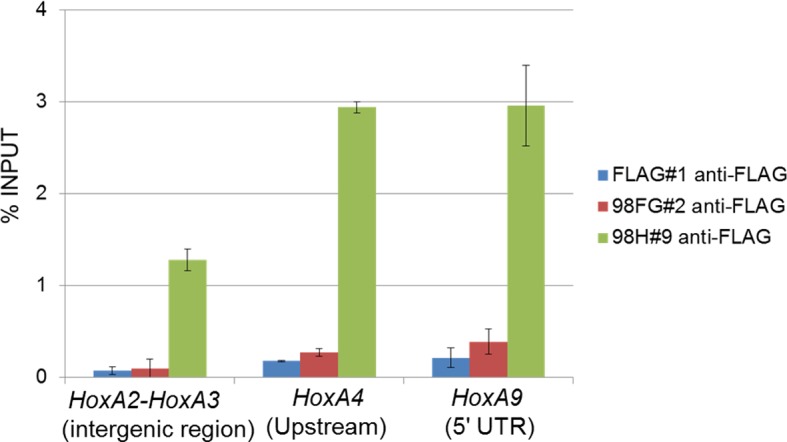
Figure 5—figure supplement 1. Binding of Nup98FG or Nup98HoxA9 to Hox-A cluster region.


