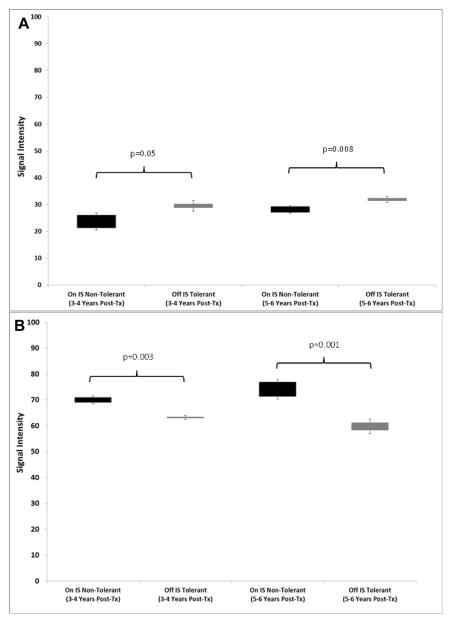
Figure 10.
A. Up-regulated Scores in PBMC. Molecular scores calculated using the 357-gene signature based on raw signal intensiities for the up-regulated genes for the Tol group (grey bar) when off IS (Years 3–4 and Years 5–6) and the non-Tol group (black bar) while on full IS (Years 3–4 and Years 5–6). ). P-values were computed using a two-tailed Student’s t-test assuming equal variance. B. Down-regulated Scores in PBMC. Molecular scores calculated using the 357-gene signature based on raw signal intensiities for the down-regulated genes for the Tol group (grey bar) when off IS (Years 3–4 and Years 5–6) and the non-Tol group (black bar) while on full IS (Years 3–4 and Years 5–6). ). P-values were computed using a two-tailed Student’s t-test assuming equal variance.

