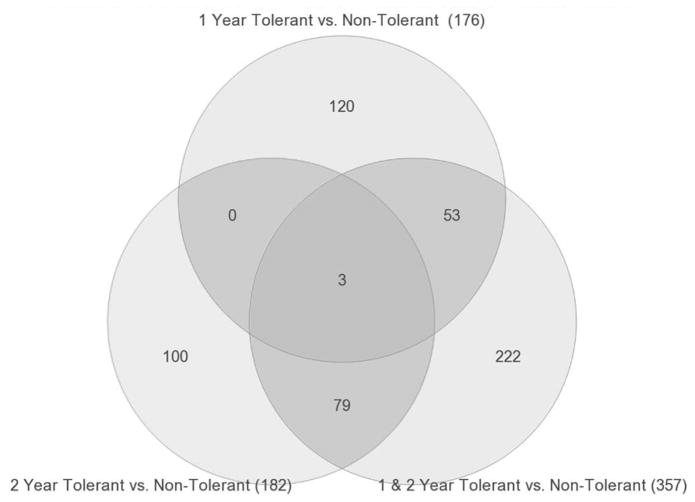
Figure 6. Venn diagram showing shared genes in PBMC when combining Years 1 and 2 post-transplant, data.
Combining the data for Tol vs non-Tol revealed 357 differentially expressed genes, 56 shared with Year 1 profiles and 82 shared with Year 2. These 357 represent genes unique to Tol subjects at both time points and potentially predictive of those patients that can be successfully weaned off IS to tolerance.

