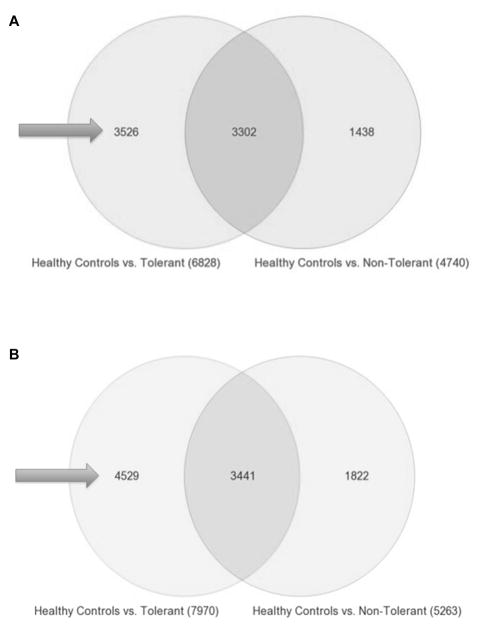
Figure 7.
A. Tol vs non-Tol – Years 3 + 4 Combined. Venn diagram showing the 3526 genes (arrows) that are unique to Tol subjects at years 3 + 4 Years post-transplant. Tol vs non-Tol subjects were compared separately to PBMC collected from 20 normal healthy volunteers to control for the effect of IS in the non-Tol group and to identify genes uniquely expressed in Tol subjects not on IS. B. Tol vs non-Tol – Years 5 + 6 Combined. Venn diagram showing the 4529 genes (arrows) that are unique to Tol subjects at years 5 + 6 Years post-transplant. Tol vs non-Tol subjects were compared separately to PBMC collected from 20 normal healthy volunteers to control for the effect of IS in the non-Tol group and to identify genes uniquely expressed in Tol subjects not on IS.

