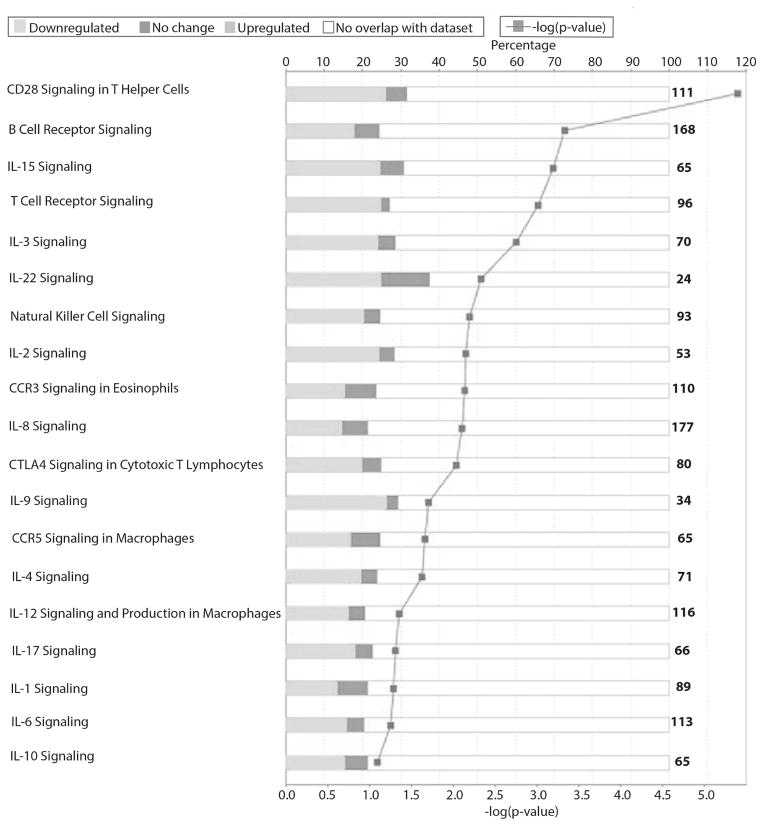
Figure 8. Mapping of the 4529 genes in PBMC at years 5 + 6 post-transplant to show the differential regulation of multiple critical immune/inflammatory pathways.
The shading of the bars clearly represent the specific suppression of these pathways, showing predominantly down-regulated genes (light grey) when compared to the up-regulated genes (dark grey). The lower X-axis represents the −log of the p-value, and the upper X-axis shows the percentage of genes in each pathway.

