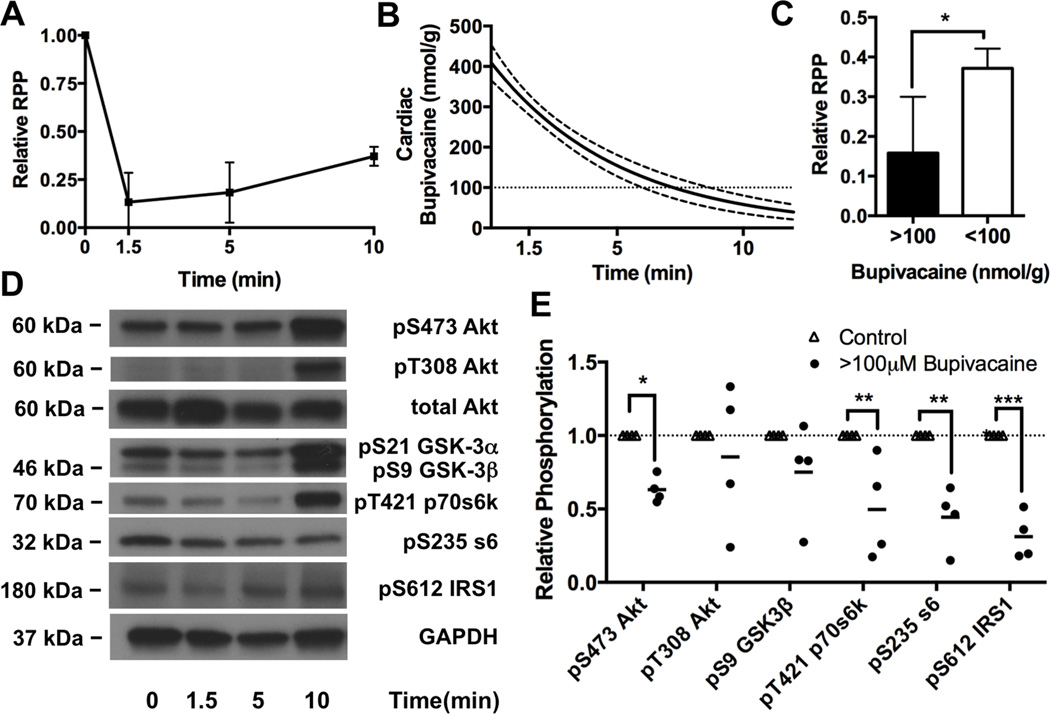
Figure 1. Cardiac phosphorylation of Protein kinase B/Akt and downstream proteins following bupivacaine toxicity.
A. Cardiac output as measured by rate-pressure-product (RPP = mean arterial pressure x heart rate) in response to bupivacaine toxicity. B. Theoretical cardiac bupivacaine (solid line) concentration with 95% confidence interval (dotted lines) based on radiolabel studies (see “Methods: Bupivacaine concentration fit curves & grouping”) C. Relative RPP difference between groups above ionotropic cation channel (e.g. sodium & calcium) IC50 (>100μm bupivacaine) and below cation channel IC50 (<100 μM bupivacaine), *:p<0.05 D. Western blots of cardiac lysates at different time-points during recovery for phospho-proteins in the insulinergic pathway including protein kinase B (Akt) phosphorylated at S473, Akt phosphorylated at T308, total Akt, glycogen synthase kinase alpha (GSK-3α) and beta (GSK-3β) phosphorylated at S21 and S9 respectively, p70 s6 kinase (p70s6k) phosphorylated at T421, ribosomal protein s6 (s6) phosphorylated at S235, Insulin receptor substrate 1 (IRS1) phosphorylated at S612, and total glyceraldehyde-3-phosphate dehydrogenase (GAPDH) as loading control. E. Densitometry of cardiac lysates (from “D”) comparing control phosphorylation (n=4) to unrecovered animals with >100μM of cardiac bupivacaine (n=4); *p<0.05, **p<0.01,***p<0.001, Sidak post-hoc test.

