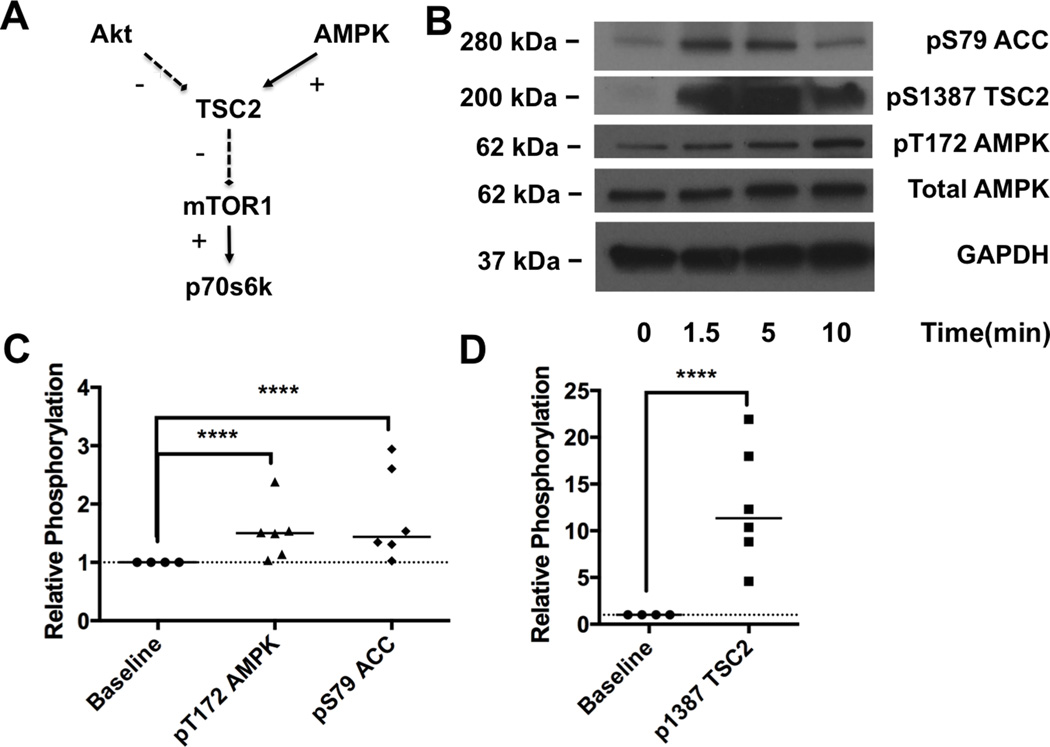
Figure 2. 5’ adenosine monophosphate activated kinase phosphorylation during toxicity.
A. Cellular signaling schematic illustrating the convergence of protein kinase B (Akt) and 5’ adenosine monophosphate activated kinases (AMPK) signaling on the mammalian target of rapamycin complex 1 (mTOR1) which controls downstream targets including p70 s6 kinase (p70s6k). B. Western blots of cardiac lysates at different time-points during recovery for the AMPK pathway including acetyl CoA carboxylase (ACC) phosphorylated at S79, tuberous sclerosis 2 (TSC2) phosphorylated at S1387, AMPK phosphorylated at T172, total AMPK and total glyceraldehyde-3-phosphate dehydrogenase (GAPDH) as loading control C. Densitometry of phospho-AMPK and phospho-ACC comparing concentrations at baseline (n=4) to concentrations during toxicity (n=6); ****p<0.0001, post-hoc Sidak test. D. Densitometry of phospho-TSC2 comparing concentrations at baseline (n=4) to concentrations during toxicity (n=6); *p<0.0001, Sidak post-hoc test.

