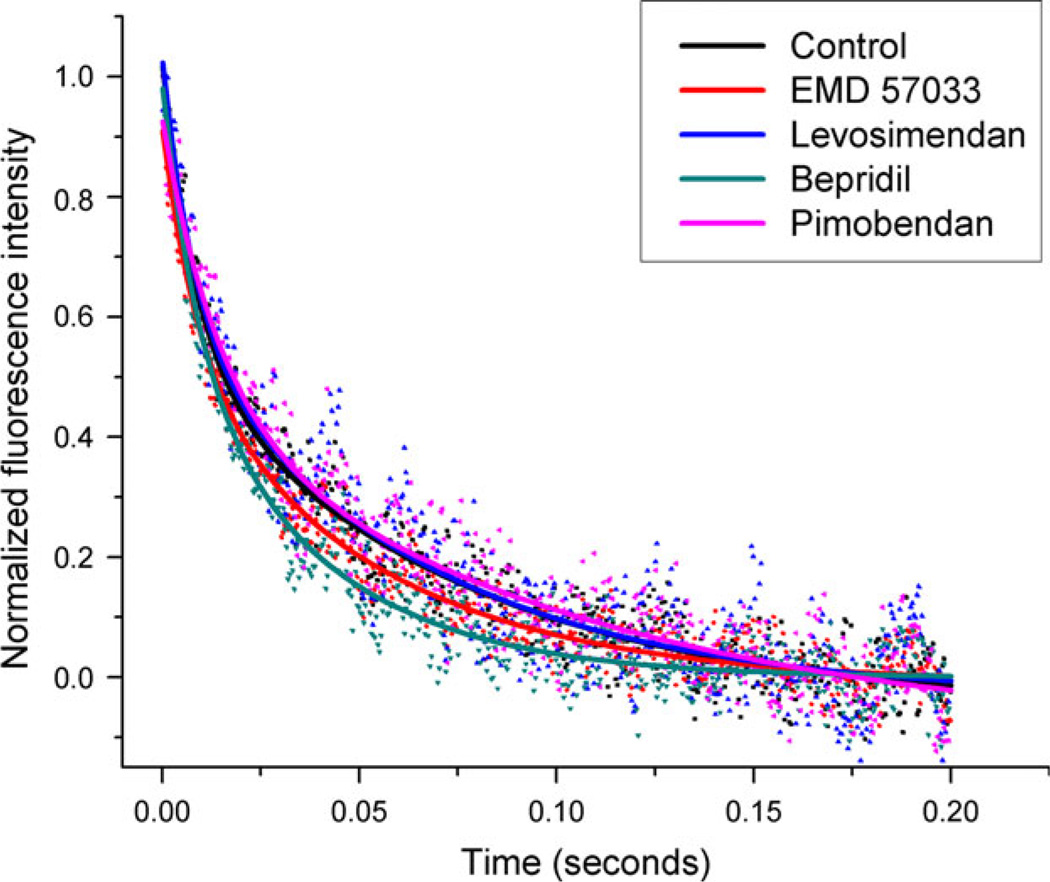
Figure 4.
Representative stopped-flow data showing BAPTA-induced Ca2+ dissociation curves in cTnC–cTnI–cTnT + actin–tropomyosin samples. Rapid mixing of 10 mM BAPTA with Ca2+-saturated samples either with Ca2+ sensitizer or with vehicle (control) induces the removal of Ca2+ from the N-domain of cTnC. This in turn leads to dissociation of cTnI from cTnC and closure of cTnC’s hydrophobic cleft. The exponential decrease in fluorescence intensity with respect to time indicates the conformational change from open to closed in cTnC’s hydrophobic cleft. This figure shows the increased rate of relaxation for cTnC in the presence of bepridil and EMD 57033, and the slight reduction in this rate caused by pimobendan and levosimendan.

