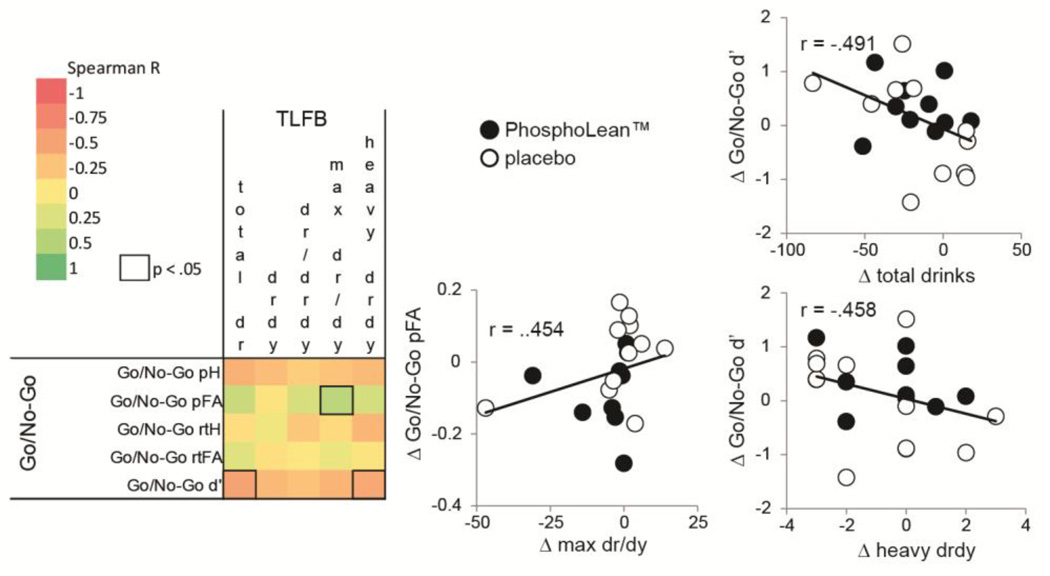
Fig. 2.
Correlation matrix for TLFB and Go/No-Go task (change in pre versus post-test). Color gradient indicates Spearman correlation coefficient. Cells with a solid outline indicate significant correlations (p < .05). Scatterplots illustrate significant correlations, with solid circles depicting values for participants in the PhosphoLean™ group and open circles depicting values for participants in the placebo group.

