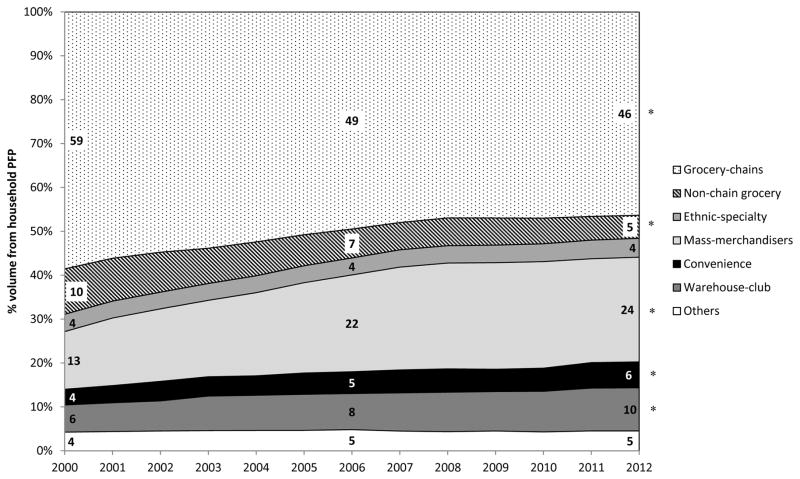
Figure 1. Trends in the proportion of annual volume from household PFP by store-type, Homescan 2000–2012.
Values represent unadjusted means using survey weighted linear regression models. * Denotes significant linear trends in the contribution of a given store-type to purchases (% volume). For all years, comparisons were made between stores, using grocery-chains as the referent group. All comparisons between stores were significantly different at a p<0.001 to account for multiple comparisons and sample size. Data comes from the 2000–2012 Nielsen Homescan panel of household packaged food purchases. All values are weighted to be nationally representative. Percentages labeled within the graph represent estimates in 2000, 2006, and 2012. Number of household-year level observations: n=652,023. University of North Carolina calculation based in part on data reported by Nielsen through its Homescan Services for all food categories, including beverages and alcohol for the 2000–2012 periods, for the U.S. market. Copyright © 2014, The Nielsen Company.

