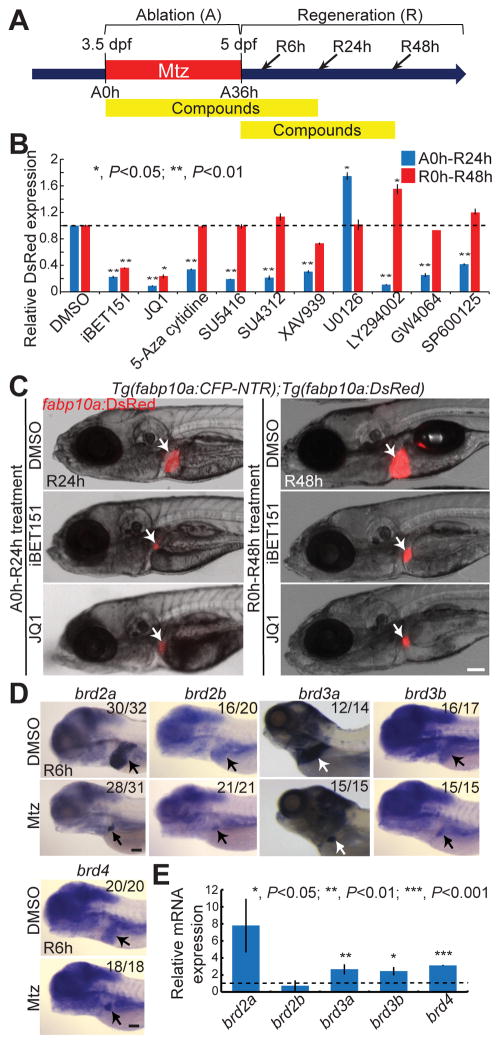
Fig. 1. BET inhibitor treatment impairs BEC-driven liver regeneration.
(A) Scheme illustrating the periods of Mtz treatment (A, ablation), compound treatment, and liver regeneration (R). Arrows indicate analysis stages. (B) Graph showing the quantification of fabp10a:DsRed expression in the regenerating larvae treated with compounds from A0h to R24h (blue) or from R0h to R48h (red) (n=5–12). (C) Epifluorescence images showing fabp10a:DsRed expression in the regenerating larvae treated with iBET151 and JQ1. Arrows point to the liver. (D) WISH images showing the expression of brd2a, brd2b, brd3a, brd3b, and brd4 in the control and regenerating liver at R6h. Numbers indicate the proportion of larvae exhibiting the representative expression shown. Arrows point to the liver. (E) qPCR data showing the relative expression levels of brd2a, brd2b, brd3a, brd3b, and brd4 between control and regenerating liver at R6h. Error bars, ±SEM; scale bars, 100 μm.

