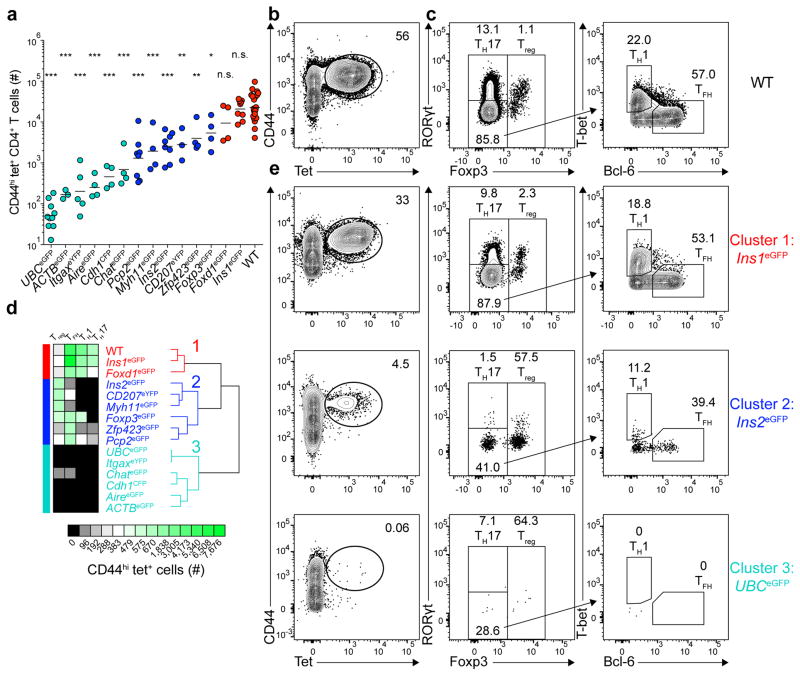
Figure 1. Three major patterns of tolerance to self-antigens.
(a) Total number of CD44hi tet+ (eGFPp:I-Ab-tetramer-binding) CD4+ T cells from pooled secondary lymphoid organs of mice 13–14 days after immunization with 100 μg of eGFPp emulsified in CFA. Horizontal bars indicate geometric mean values. Depicted results were pooled from 12 independent experiments, n=3–23 total mice per group. Circles represent individual mice and are colored according to the clusters identified in (d). (* P<0.05, ** P<0.005, *** P<0.0001, n.s. = not significant by one-way ANOVA of log10 transformed data relative to wild-type (WT) B6 mice).
(b) Contour plot showing CD44 and tetramer staining from tetramer-enriched CD4+ T cells from pooled secondary lymphoid organs of WT mice primed 14 days earlier with eGFPp in CFA. CD4+CD44hi tet+ cells are identified in the elliptical gate.
(c) Plots depicting transcription factor expression in the CD4+CD44hi tet+ cells identified in (b). Left, Foxp3 and RORγt expression by tet+ cells. Right, T-bet and Bcl-6 expression by Foxp3−RORγt− tet+ cells.
(d) Unsupervised hierarchical clustering of CD4+CD44hi tet+ T cells (geometric mean cell numbers and phenotypes) in the 15 indicated mouse strains using the HierarchicalClustering module from GenePattern. Three major clusters are indicated.
(e) Plots showing CD44 and tetramer staining of tetramer-enriched CD4+ T cells from pooled secondary lymphoid organs of three different eGFP expressing mouse strains that are representative examples of Clusters 1–3, identified in (d) (left panel) and transcription factor expression by the CD4+CD44hi tet+ cells identified in the elliptical gates in the left panels.
Numbers on each plot in (b–c) and (e) indicate the percent of cells in each gate.

