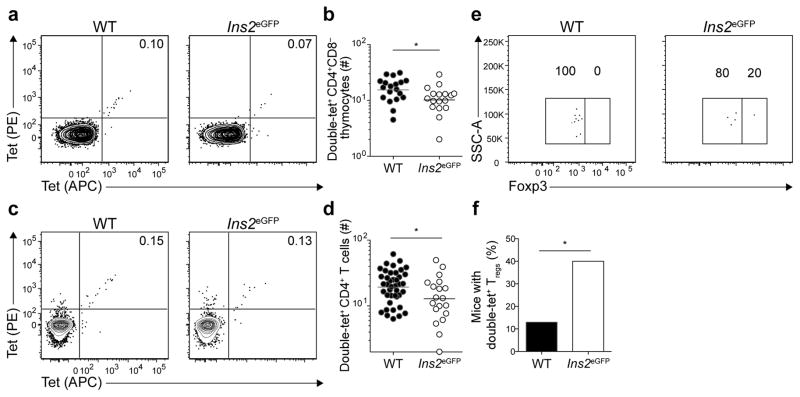
Figure 3. eGFPp:I-Ab-specific CD4+ T cells undergo limited clonal deletion in the thymus.
(a) Contour plots of tet-PE versus tet-APC staining of tetramer-enriched CD4+CD8− thymocytes from WT or Ins2eGFP mice.
(b) Numbers of double-tet+ CD4+CD8− thymocytes from WT and Ins2eGFP mice. Results are pooled from 5 experiments, n=17–19 total mice per group. (* P<0.05 by unpaired t-test of log10 transformed data). Horizontal bars indicate geometric mean values and circles represent individual mice.
(c) Contour plots of tet-PE versus tet-APC staining of tetramer-enriched CD4+ T cells from pooled spleens and lymph nodes of unimmunized WT or Ins2eGFP mice.
(d) Numbers of double-tet+ CD4+ T cells from pooled spleens and lymph nodes of WT or Ins2eGFP mice. Results are pooled from 8 experiments, n=20–41 total mice per group. Horizontal bars indicate geometric mean values and circles represent individual mice. (* P<0.05 by unpaired t-test of log10 transformed data).
(e) Dot plots of Foxp3 expression by double-tet+ CD4+CD8− thymocytes from WT and Ins2eGFP mice. Data are representative of samples from 5 independent experiments with n = 23 for WT mice and 20 mice for Ins2eGFP mice.
(f) Frequency of mice with double-tet+ Treg cells detected in the thymus. Data are pooled from 5 independent experiments with n = 23 for WT mice and 20 mice for Ins2eGFP mice. (*P<0.05 by Chi-square test).
Numbers on each plot in (a), (c), and (e) indicate the percent of cells in the quadrant or gate.

