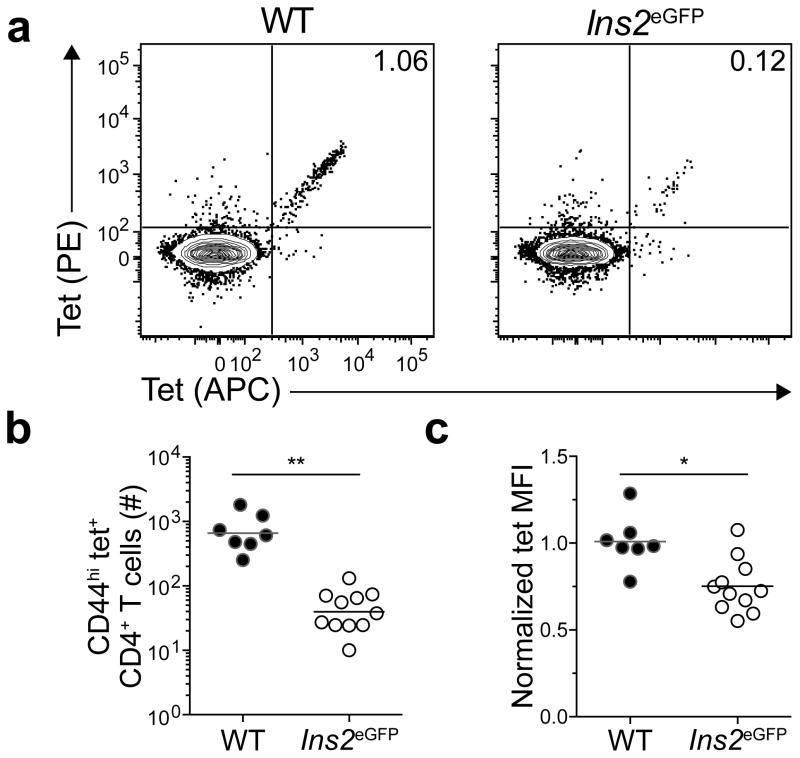
Figure 4. High affinity T cells are deleted in Ins2eGFP mice.
(a) Contour plots of tet-PE versus tet-APC staining of tetramer-enriched CD4+ T cells from pooled spleens and lymph nodes of WT or Ins2eGFP mice 6–7 days after infection with the ΔactAΔinlB strain of L. monocytogenes (Lm-eGFP). Numbers indicate the percent of double-tet+ cells.
(b) Numbers of CD44hi tet+ CD4+ T cells from pooled spleens and lymph nodes of mice 6–7 days after infection with Lm-eGFP. Horizontal bars indicate geometric mean values and circles represent individual mice. Data are pooled from 3 independent experiments, n=7–11 total mice per group. (** P<0.0001 by unpaired t-test of log10 transformed data).
(c) Normalized tetramer mean fluorescence intensity (MFI) of cells identified in (b). MFIs within each experiment were normalized to those of WT controls. Horizontal bars indicate mean values and circles represent individual mice. Data are pooled from 3 independent experiments, n=7–11 total mice per group. (* P<0.005 by unpaired t-test).

