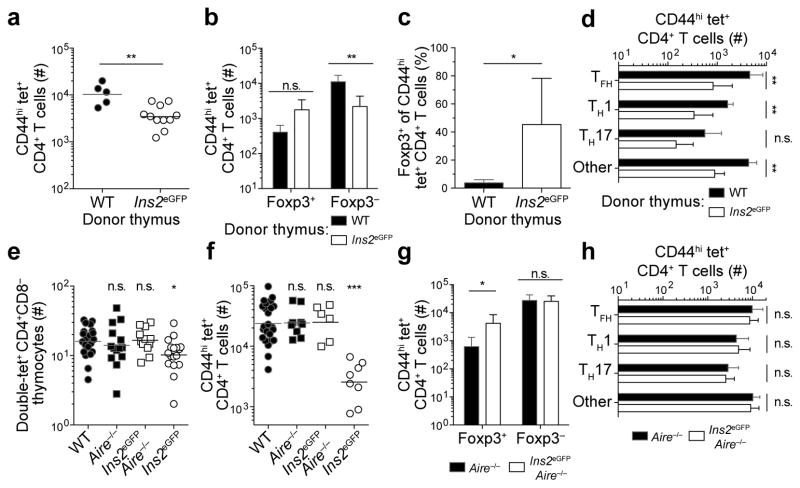
Figure 5. Aire-mediated thymic expression of eGFP promotes clonal deletion and Treg induction in Ins2eGFP mice.
(a) Numbers of CD44hi tet+ CD4+ T cells per B6-nude mouse 14 days after immunization with 100 μg of eGFPp in CFA. Mice received WT or Ins2eGFP thymus grafts eight-twelve weeks before immunization, n=5–11 total mice per group.
(b) Numbers of CD44hi tet+ CD4+ Foxp3+ Treg cells and Foxp3− effector T cells from mice in (a).
(c) Frequency of Foxp3+ T cells among cells identified in (a).
(d) Numbers of each Foxp3− T effector cell subset in populations from (a).
(e) Numbers of double-tet+ CD4+CD8− thymocytes in WT, Aire−/−, Ins2eGFPAire−/−, and Ins2eGFP mice. Cells were double-tetramer stained and analyzed as in Figure 2a. Data for WT and Ins2eGFP mice are replotted from Figure 3b, n=12–21 total mice per group.
(f) Numbers of CD44hi tet+ CD4+ T cells per mouse 14 days after immunization of WT, Aire−/−, Ins2eGFPAire−/−, and Ins2eGFP mice with eGFPp in CFA. Data for WT and Ins2eGFP mice are replotted from Figure 1a, n=6–23 total mice per group.
(g) Numbers of CD44hi tet+ Foxp3+ Treg cells and Foxp3− effector T cells from mice in (f).
(h) Numbers of each Foxp3− T effector cell subset among cells enumerated in (f). Data are from 2 (a–d), 6 (e), and 5 (f–h) independent experiments. Data are from pooled spleens and lymph nodes (a–d) and (f–h) or thymuses (e) of indicated mice. Horizontal bars indicate geometric means and symbols represent individual mice (a) and (e–f). Error bars indicate standard deviations in (b–d) and (g–h). * P<0.05, ** P<0.005, *** P<0.0001, n.s. = not significant by unpaired t-test of log10 transformed data (a–b), (d), (g–h); unpaired t-test (c); or one-way ANOVA of log10 transformed data (e–f).

