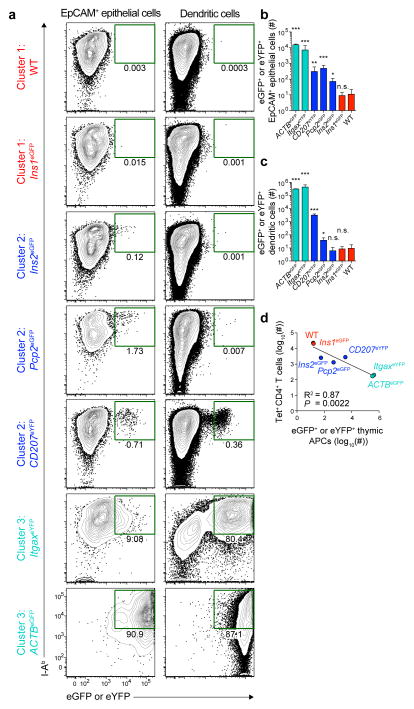
Figure 7. Frequency of self-antigen+ thymic antigen-presenting cells correlates with the responsiveness of the corresponding CD4+ T cell population.
(a) Contour plots of MHCII (I-Ab) and eGFP+ or eYFP+ expression by EpCAM+ thymic epithelial cells (left) and thymic dendritic cells (right) from the indicated members of Clusters 1–3. Plots are from 5 experiments. Numbers indicate the percent of cells that are I-Ab+ and either eGFP+ or eYFP+.
(b) Numbers of eGFP+ or eYFP+ EpCAM+ thymic epithelial cells in the indicated mouse strains, identified as in (a). Bars are colored according to the clusters identified in Figure 1d. Error bars represent the standard deviations. (n=3–6 total mice per group, * P<0.05, ** P<0.0005, *** P<0.0001, n.s. = not significant by one-way ANOVA of log10 transformed data).
(c) Numbers of eGFP+ or eYFP+ thymic dendritic cells in the indicated mouse strains, identified as in (a). Bars are colored according to the clusters identified in Figure 1d. Error bars represent the standard deviations. (n=3–6 total mice per group, * P<0.05, *** P<0.0001, n.s. = not significant by one-way ANOVA of log10 transformed data).
(d) Linear regression analysis of the log10(number of eGFP+ or eYFP+ thymic antigen-presenting cells) versus log10(number of tet+ CD4+ T cells 14 days after immunization). Each point represents values for an individual mouse strain as indicated. For each point, the y-axis value represents the log10(geometric mean from Figure 1a), and the x-axis value represents the log10(geometric mean for the total number of I-Ab+ eGFP+ or eYFP+ EpCAM+ thymic epithelial cells and dendritic cells for each strain). Circles and labels are colored according to the clusters identified in Figure 1d.

