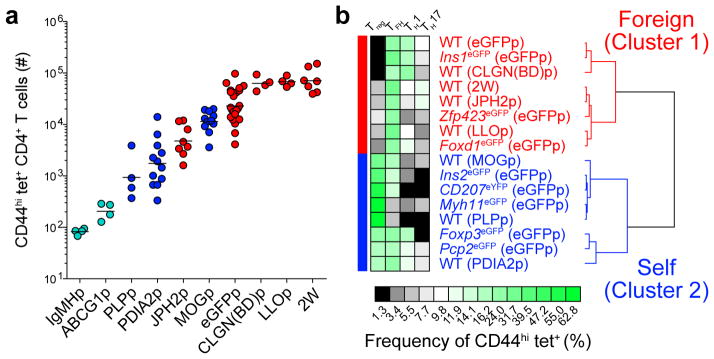
Figure 8. Tolerance mechanisms identified in eGFP expressing mouse strains govern tolerance to true self-antigens.
(a) Numbers of CD44hi peptide:I-Ab+ (tet+) CD4+ T cells from pooled spleens and lymph nodes of mice 13–14 days after immunization with 100 μg of each indicated peptide emulsified in CFA. Horizontal bars indicate geometric mean values. Data were pooled from 17 experiments, n=4–23 total mice per epitope. Circles represent individual mice and are colored according to the clusters identified in (b).
(b) Unsupervised hierarchical clustering of 16 self- and foreign- tet+ CD4+ T cell populations from (a). Profiles were clustered by percentage of cells of each subset as displayed in the heatmap. Two major clusters are indicated.

