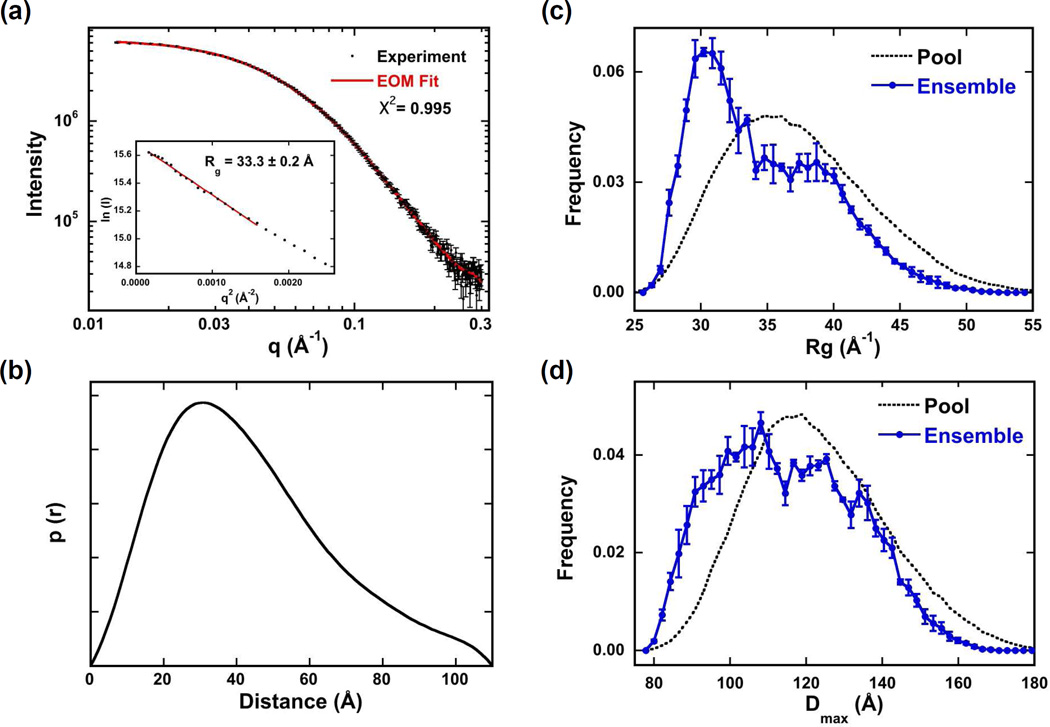
Figure 5.
SAXS analysis of PKRΔV conformation. Data were collected at 4°C at a protein concentration of 5 mg/ml. (a) Scattering data (points) and EOM fit (solid red line). Inset: Guinier analysis yields Rg = 33.3 ± 0.2 Å. (b) p(r) distance distribution produced by transforming the data in part (a) using GNOM.23 Rg (c) and Dmax (d) distributions produced by fitting the data in part (a) using EOM.24,25 The distributions of the random pool of 10,000 structures are shown in black dotted lines and the distributions selected by the genetic algorithm to fit the experimental data are shown in solid blue. The error bars correspond to the standard deviations of the distributions produced from three runs of GAJOE.

