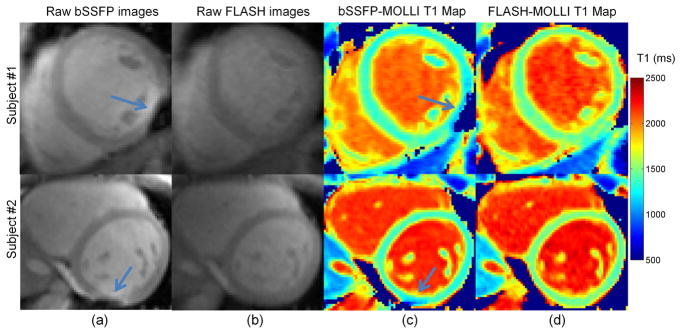
Figure 6.
Example of raw bSSFP-MOLLI and FLASH-MOLLI images and T1 maps of the mid-left ventricular short-axis at 3.0T in two healthy volunteers. The raw bSSFP-MOLLI images (a) show severe off-resonance artifacts in the inferolateral wall, while the raw FLASH-MOLLI images (b) do not have artifacts. Corresponding bSSFP-MOLLI T1 maps (c) show reduced and inhomogeneous T1 values in the same region (arrow indicates region), and at extended regions beyond the locations with off-resonance artifacts while FLASH-MOLLI T1 maps (d) do not have these artifacts and have homogeneous myocardial T1 values.

