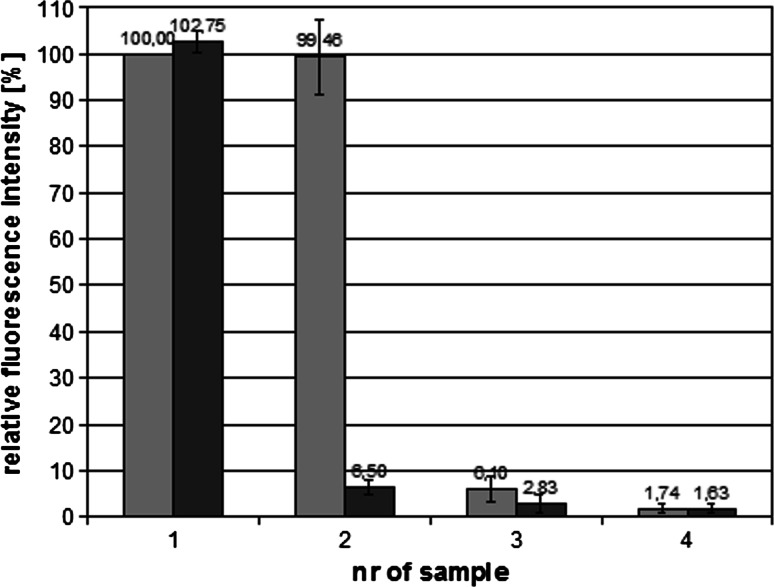
Fig. 2.
Assessment of the polymer affinity to bacterial cells. The graph shows the relative fluorescence of polymer solutions: 1-polymer solution (12 mg/ml) and bacterial suspension with the polymer (grey and black bar respectively); 2,3,4-supernatant and bacterial suspension (grey and black bar respectively) after first, second and third centrifugation; (n = 6)

