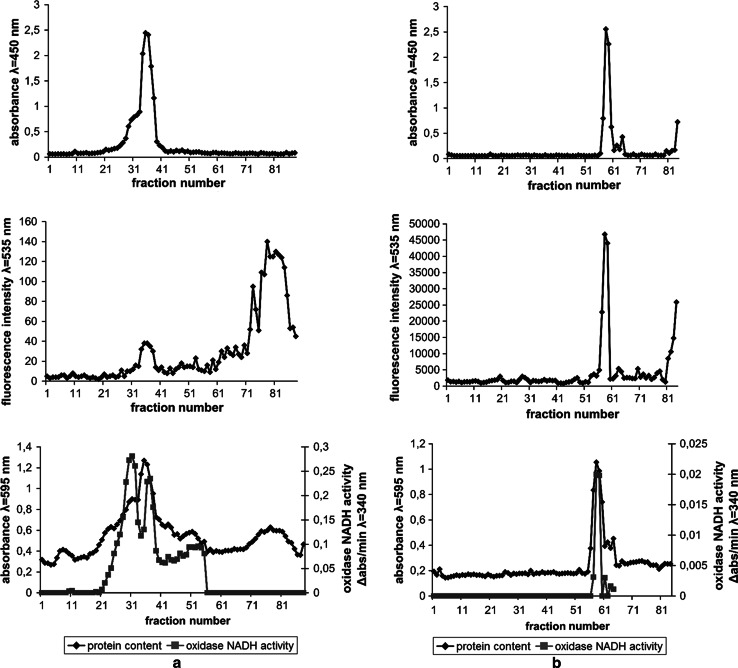
Fig. 9.
Membrane fractions isolated after incubation of “crude” membrane fractions with 1.2 mg/ml polymer (a) and 4 mg/ml polymer (b). The fractions were analysed for light scattering at λ = 450 nm (top figures), polymer fluorescence at λ = 535 nm (middle figures), protein content and oxidase NADH activity (bottom figures)

