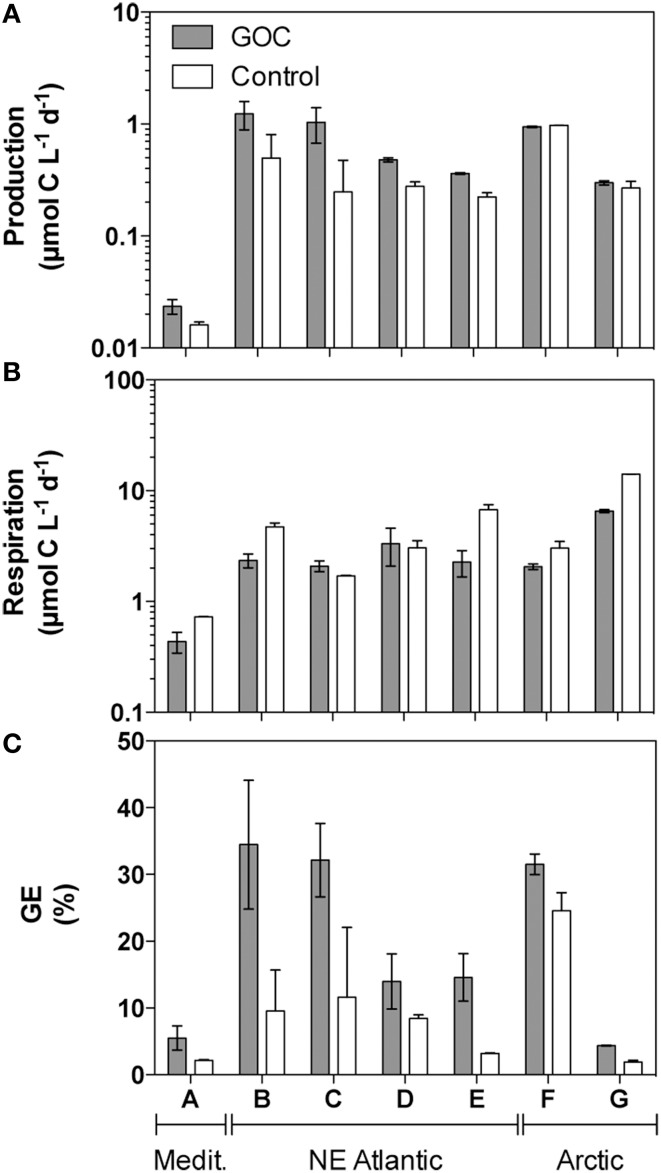
Figure 2.
Prokaryotic production (P, panel A), respiration (R, panel B), and Growth Efficiency (GE, panel C) in microcosms containing natural GOC (filled bars) vs. GOC-free controls (open bars). Bars represent the average value and the error bars represent the range (minimum and maximum) for duplicate microcosms. Letters on the x-axis indicate the origin of the sample as in Table 1. Please note the logarithmic scale on panels (A, B).

