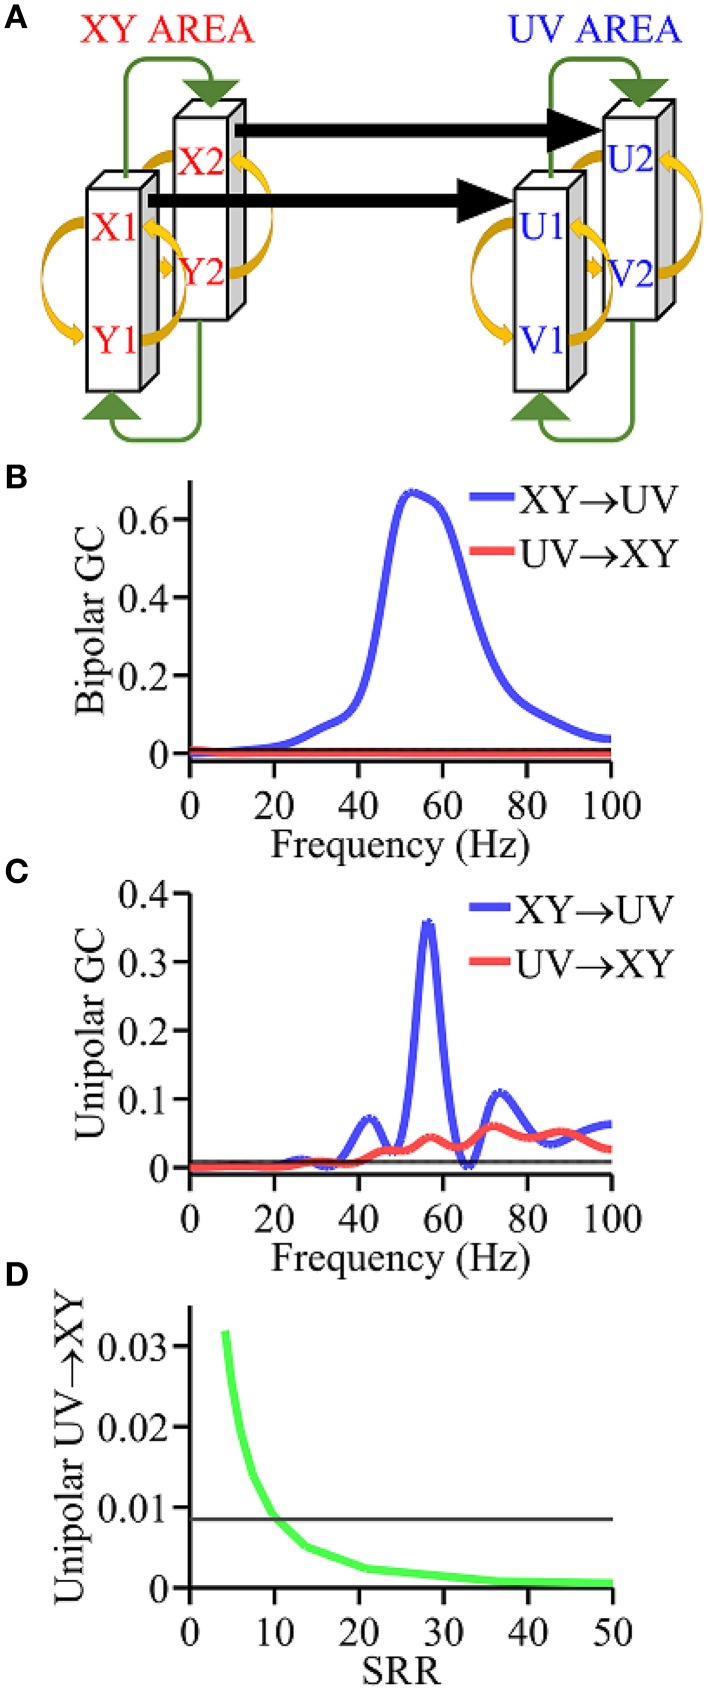
Figure 1.
Simulation model. (A) Coupling scheme. (B) Granger causality spectra using bipolar signals which are in agreement with ground truth. (C) Granger causality spectra using unipolar signals which are not in agreement with ground truth. (D) Analysis of the unipolar Granger causality UV → XY as a function of the signal to reference ratio (SRR) (green curve). Black horizontal lines in (B–D) represents the level of statistical significance (p < 0.05).

